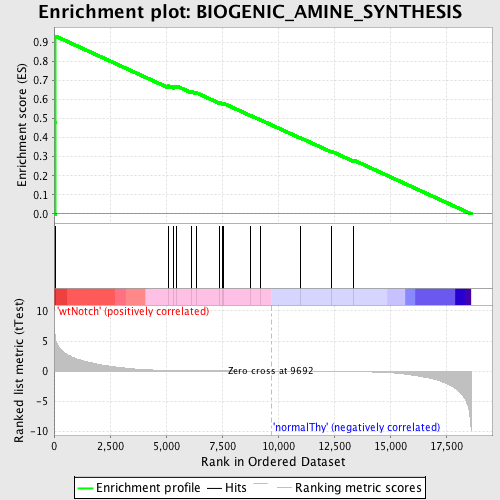
Profile of the Running ES Score & Positions of GeneSet Members on the Rank Ordered List
| Dataset | Set_03_wtNotch_versus_normalThy.phenotype_wtNotch_versus_normalThy.cls #wtNotch_versus_normalThy.phenotype_wtNotch_versus_normalThy.cls #wtNotch_versus_normalThy_repos |
| Phenotype | phenotype_wtNotch_versus_normalThy.cls#wtNotch_versus_normalThy_repos |
| Upregulated in class | wtNotch |
| GeneSet | BIOGENIC_AMINE_SYNTHESIS |
| Enrichment Score (ES) | 0.931985 |
| Normalized Enrichment Score (NES) | 1.700326 |
| Nominal p-value | 0.0 |
| FDR q-value | 0.03442545 |
| FWER p-Value | 0.346 |
| PROBE | DESCRIPTION (from dataset) | GENE SYMBOL | GENE_TITLE | RANK IN GENE LIST | RANK METRIC SCORE | RUNNING ES | CORE ENRICHMENT | |
|---|---|---|---|---|---|---|---|---|
| 1 | DDC | 670408 | 52 | 5.658 | 0.4789 | Yes | ||
| 2 | COMT | 360687 510577 5700092 | 62 | 5.328 | 0.9320 | Yes | ||
| 3 | SLC18A3 | 3060035 | 5090 | 0.126 | 0.6725 | No | ||
| 4 | MAOA | 1410039 4610324 | 5328 | 0.111 | 0.6692 | No | ||
| 5 | TH | 2100056 | 5482 | 0.103 | 0.6697 | No | ||
| 6 | CHAT | 6840603 | 6123 | 0.074 | 0.6416 | No | ||
| 7 | GAD2 | 1400088 | 6352 | 0.066 | 0.6349 | No | ||
| 8 | PNMT | 4210563 | 7364 | 0.040 | 0.5840 | No | ||
| 9 | AANAT | 610609 | 7524 | 0.036 | 0.5785 | No | ||
| 10 | DBH | 3610458 | 7564 | 0.036 | 0.5794 | No | ||
| 11 | HDC | 4150463 | 8785 | 0.014 | 0.5150 | No | ||
| 12 | GAD1 | 2360035 3140167 | 9221 | 0.007 | 0.4922 | No | ||
| 13 | PAH | 3800309 | 10989 | -0.019 | 0.3989 | No | ||
| 14 | TPH1 | 780180 | 12374 | -0.047 | 0.3285 | No | ||
| 15 | ACHE | 5290750 | 13377 | -0.082 | 0.2816 | No |

