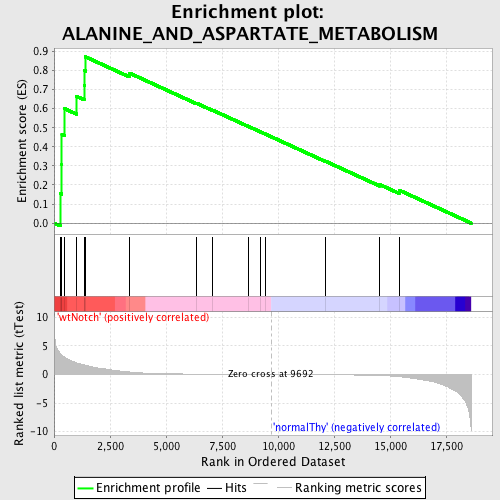
Profile of the Running ES Score & Positions of GeneSet Members on the Rank Ordered List
| Dataset | Set_03_wtNotch_versus_normalThy.phenotype_wtNotch_versus_normalThy.cls #wtNotch_versus_normalThy.phenotype_wtNotch_versus_normalThy.cls #wtNotch_versus_normalThy_repos |
| Phenotype | phenotype_wtNotch_versus_normalThy.cls#wtNotch_versus_normalThy_repos |
| Upregulated in class | wtNotch |
| GeneSet | ALANINE_AND_ASPARTATE_METABOLISM |
| Enrichment Score (ES) | 0.8713755 |
| Normalized Enrichment Score (NES) | 1.6840013 |
| Nominal p-value | 0.0 |
| FDR q-value | 0.04546796 |
| FWER p-Value | 0.458 |
| PROBE | DESCRIPTION (from dataset) | GENE SYMBOL | GENE_TITLE | RANK IN GENE LIST | RANK METRIC SCORE | RUNNING ES | CORE ENRICHMENT | |
|---|---|---|---|---|---|---|---|---|
| 1 | AARS | 1570279 2370136 | 276 | 3.697 | 0.1553 | Yes | ||
| 2 | NARS | 1660722 | 343 | 3.427 | 0.3095 | Yes | ||
| 3 | CAD | 2340717 | 350 | 3.407 | 0.4659 | Yes | ||
| 4 | ADSL | 5570484 | 457 | 3.043 | 0.6003 | Yes | ||
| 5 | GOT1 | 2940465 | 1005 | 2.027 | 0.6642 | Yes | ||
| 6 | GPT | 2350270 | 1343 | 1.677 | 0.7232 | Yes | ||
| 7 | ASNS | 110368 7100687 | 1366 | 1.659 | 0.7984 | Yes | ||
| 8 | GPT2 | 1850463 | 1402 | 1.627 | 0.8714 | Yes | ||
| 9 | GOT2 | 4570164 5220450 | 3364 | 0.442 | 0.7863 | No | ||
| 10 | GAD2 | 1400088 | 6352 | 0.066 | 0.6287 | No | ||
| 11 | AGXT | 5910338 | 7083 | 0.045 | 0.5916 | No | ||
| 12 | ASPA | 3290400 | 8656 | 0.016 | 0.5078 | No | ||
| 13 | GAD1 | 2360035 3140167 | 9221 | 0.007 | 0.4778 | No | ||
| 14 | DARS | 580427 3840139 | 9428 | 0.004 | 0.4669 | No | ||
| 15 | CRAT | 540020 2060364 3520148 | 12114 | -0.041 | 0.3244 | No | ||
| 16 | ASL | 1240601 5340309 5360082 | 14535 | -0.171 | 0.2022 | No | ||
| 17 | ABAT | 1940520 2690021 5690167 | 15408 | -0.372 | 0.1725 | No |

