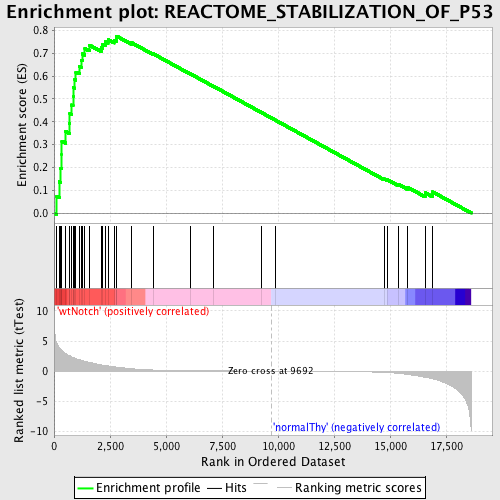
Profile of the Running ES Score & Positions of GeneSet Members on the Rank Ordered List
| Dataset | Set_03_wtNotch_versus_normalThy.phenotype_wtNotch_versus_normalThy.cls #wtNotch_versus_normalThy.phenotype_wtNotch_versus_normalThy.cls #wtNotch_versus_normalThy_repos |
| Phenotype | phenotype_wtNotch_versus_normalThy.cls#wtNotch_versus_normalThy_repos |
| Upregulated in class | wtNotch |
| GeneSet | REACTOME_STABILIZATION_OF_P53 |
| Enrichment Score (ES) | 0.77571315 |
| Normalized Enrichment Score (NES) | 1.7390229 |
| Nominal p-value | 0.0 |
| FDR q-value | 0.0046219653 |
| FWER p-Value | 0.066 |
| PROBE | DESCRIPTION (from dataset) | GENE SYMBOL | GENE_TITLE | RANK IN GENE LIST | RANK METRIC SCORE | RUNNING ES | CORE ENRICHMENT | |
|---|---|---|---|---|---|---|---|---|
| 1 | PSMB1 | 2940402 | 120 | 4.592 | 0.0744 | Yes | ||
| 2 | TP53 | 6130707 | 229 | 3.880 | 0.1370 | Yes | ||
| 3 | PSMD14 | 5690593 | 297 | 3.628 | 0.1973 | Yes | ||
| 4 | PSMA4 | 4560427 | 344 | 3.426 | 0.2551 | Yes | ||
| 5 | PSMB10 | 630504 6510039 | 349 | 3.408 | 0.3149 | Yes | ||
| 6 | PSMC5 | 2760315 6550021 | 519 | 2.882 | 0.3566 | Yes | ||
| 7 | PSMC3 | 2480184 | 677 | 2.568 | 0.3934 | Yes | ||
| 8 | PSME3 | 2810537 | 703 | 2.529 | 0.4366 | Yes | ||
| 9 | PSMD12 | 730044 | 790 | 2.371 | 0.4738 | Yes | ||
| 10 | PSMD8 | 630142 | 846 | 2.266 | 0.5107 | Yes | ||
| 11 | PSMC2 | 7040010 | 854 | 2.254 | 0.5500 | Yes | ||
| 12 | PSMA7 | 2230131 | 925 | 2.151 | 0.5842 | Yes | ||
| 13 | PSMA2 | 6510093 | 973 | 2.074 | 0.6182 | Yes | ||
| 14 | PSMB9 | 6980471 | 1130 | 1.882 | 0.6429 | Yes | ||
| 15 | PSMB3 | 4280594 | 1211 | 1.799 | 0.6703 | Yes | ||
| 16 | PSMB5 | 6290242 | 1272 | 1.738 | 0.6977 | Yes | ||
| 17 | PSMB6 | 2690711 | 1374 | 1.653 | 0.7214 | Yes | ||
| 18 | PSMD3 | 1400647 | 1574 | 1.461 | 0.7364 | Yes | ||
| 19 | PSMC6 | 2810021 | 2104 | 1.035 | 0.7261 | Yes | ||
| 20 | PSMC4 | 580050 1580025 | 2169 | 1.001 | 0.7403 | Yes | ||
| 21 | PSMA5 | 5390537 | 2289 | 0.953 | 0.7507 | Yes | ||
| 22 | PSMD7 | 2030619 6220594 | 2407 | 0.876 | 0.7598 | Yes | ||
| 23 | PSMC1 | 6350538 | 2674 | 0.725 | 0.7583 | Yes | ||
| 24 | PSME1 | 450193 4480035 | 2780 | 0.668 | 0.7644 | Yes | ||
| 25 | PSMD2 | 4670706 5050364 | 2788 | 0.664 | 0.7757 | Yes | ||
| 26 | PSMD10 | 520494 1170576 3830050 | 3463 | 0.403 | 0.7465 | No | ||
| 27 | MDM2 | 3450053 5080138 | 4426 | 0.187 | 0.6981 | No | ||
| 28 | ATM | 3610110 4050524 | 6074 | 0.076 | 0.6108 | No | ||
| 29 | PSMA6 | 50609 | 7110 | 0.045 | 0.5558 | No | ||
| 30 | PSMD5 | 3940139 4570041 | 9264 | 0.006 | 0.4401 | No | ||
| 31 | PSMA1 | 380059 2760195 | 9875 | -0.002 | 0.4073 | No | ||
| 32 | PSMB4 | 520402 | 14735 | -0.202 | 0.1493 | No | ||
| 33 | PSMD11 | 2340538 6510053 | 14886 | -0.231 | 0.1453 | No | ||
| 34 | PSMD4 | 430068 | 15355 | -0.356 | 0.1264 | No | ||
| 35 | PSMD9 | 50020 5890368 | 15775 | -0.532 | 0.1132 | No | ||
| 36 | PSMA3 | 5900047 7040161 | 16565 | -1.000 | 0.0884 | No | ||
| 37 | PSMB2 | 940035 4210324 | 16898 | -1.247 | 0.0925 | No |

