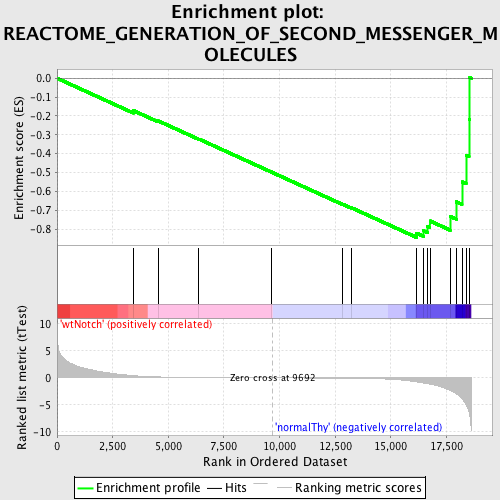
Profile of the Running ES Score & Positions of GeneSet Members on the Rank Ordered List
| Dataset | Set_03_wtNotch_versus_normalThy.phenotype_wtNotch_versus_normalThy.cls #wtNotch_versus_normalThy.phenotype_wtNotch_versus_normalThy.cls #wtNotch_versus_normalThy_repos |
| Phenotype | phenotype_wtNotch_versus_normalThy.cls#wtNotch_versus_normalThy_repos |
| Upregulated in class | normalThy |
| GeneSet | REACTOME_GENERATION_OF_SECOND_MESSENGER_MOLECULES |
| Enrichment Score (ES) | -0.8438681 |
| Normalized Enrichment Score (NES) | -1.5732888 |
| Nominal p-value | 0.0058708414 |
| FDR q-value | 0.11378285 |
| FWER p-Value | 0.896 |
| PROBE | DESCRIPTION (from dataset) | GENE SYMBOL | GENE_TITLE | RANK IN GENE LIST | RANK METRIC SCORE | RUNNING ES | CORE ENRICHMENT | |
|---|---|---|---|---|---|---|---|---|
| 1 | ZAP70 | 1410494 2260504 | 3430 | 0.417 | -0.1715 | No | ||
| 2 | ENAH | 1690292 5700300 | 4552 | 0.174 | -0.2263 | No | ||
| 3 | GRAP2 | 7100441 1410647 | 6376 | 0.065 | -0.3223 | No | ||
| 4 | NCK1 | 6200575 6510050 | 9651 | 0.001 | -0.4983 | No | ||
| 5 | PLCG1 | 6020369 | 12826 | -0.060 | -0.6671 | No | ||
| 6 | PAK1 | 4540315 | 13219 | -0.075 | -0.6859 | No | ||
| 7 | LCP2 | 2680066 6650707 | 16159 | -0.742 | -0.8209 | Yes | ||
| 8 | WAS | 5270193 | 16461 | -0.938 | -0.8079 | Yes | ||
| 9 | LAT | 3170025 | 16642 | -1.039 | -0.7854 | Yes | ||
| 10 | FYB | 1690440 | 16760 | -1.136 | -0.7564 | Yes | ||
| 11 | LCK | 3360142 | 17665 | -2.357 | -0.7319 | Yes | ||
| 12 | CD3D | 2810739 | 17940 | -2.964 | -0.6547 | Yes | ||
| 13 | CD4 | 1090010 | 18200 | -3.836 | -0.5495 | Yes | ||
| 14 | CD3E | 3800056 | 18384 | -4.904 | -0.4072 | Yes | ||
| 15 | CD3G | 2680288 | 18515 | -6.372 | -0.2165 | Yes | ||
| 16 | ITK | 2230592 | 18551 | -7.151 | 0.0035 | Yes |

