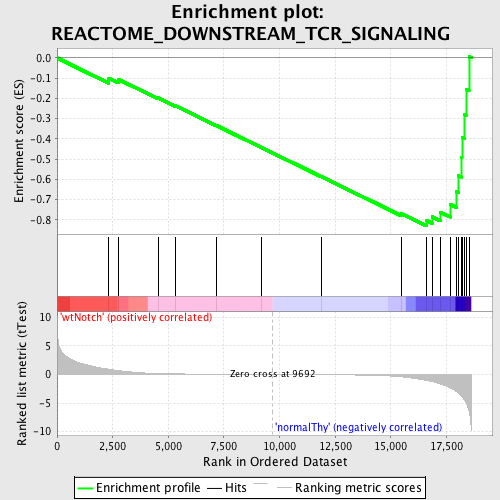
Profile of the Running ES Score & Positions of GeneSet Members on the Rank Ordered List
| Dataset | Set_03_wtNotch_versus_normalThy.phenotype_wtNotch_versus_normalThy.cls #wtNotch_versus_normalThy.phenotype_wtNotch_versus_normalThy.cls #wtNotch_versus_normalThy_repos |
| Phenotype | phenotype_wtNotch_versus_normalThy.cls#wtNotch_versus_normalThy_repos |
| Upregulated in class | normalThy |
| GeneSet | REACTOME_DOWNSTREAM_TCR_SIGNALING |
| Enrichment Score (ES) | -0.83001244 |
| Normalized Enrichment Score (NES) | -1.6281389 |
| Nominal p-value | 0.0075901328 |
| FDR q-value | 0.07622046 |
| FWER p-Value | 0.569 |
| PROBE | DESCRIPTION (from dataset) | GENE SYMBOL | GENE_TITLE | RANK IN GENE LIST | RANK METRIC SCORE | RUNNING ES | CORE ENRICHMENT | |
|---|---|---|---|---|---|---|---|---|
| 1 | NFKB1 | 5420358 | 2322 | 0.926 | -0.1005 | No | ||
| 2 | MAP3K7 | 6040068 | 2753 | 0.679 | -0.1057 | No | ||
| 3 | UBE2N | 520369 2900047 | 4546 | 0.174 | -0.1975 | No | ||
| 4 | RIPK2 | 5050072 6290632 | 5335 | 0.111 | -0.2370 | No | ||
| 5 | PIK3R1 | 4730671 | 7165 | 0.043 | -0.3342 | No | ||
| 6 | PRKCQ | 2260170 3870193 | 9201 | 0.007 | -0.4434 | No | ||
| 7 | CHUK | 7050736 | 11886 | -0.036 | -0.5868 | No | ||
| 8 | IKBKB | 6840072 | 15462 | -0.391 | -0.7687 | No | ||
| 9 | PIK3CB | 3800600 | 16603 | -1.014 | -0.8033 | Yes | ||
| 10 | PTEN | 3390064 | 16854 | -1.207 | -0.7850 | Yes | ||
| 11 | RELA | 3830075 | 17220 | -1.623 | -0.7619 | Yes | ||
| 12 | LCK | 3360142 | 17665 | -2.357 | -0.7238 | Yes | ||
| 13 | CD3D | 2810739 | 17940 | -2.964 | -0.6606 | Yes | ||
| 14 | BCL10 | 2360397 | 18036 | -3.190 | -0.5817 | Yes | ||
| 15 | NFKBIA | 1570152 | 18160 | -3.680 | -0.4915 | Yes | ||
| 16 | CD4 | 1090010 | 18200 | -3.836 | -0.3927 | Yes | ||
| 17 | PDPK1 | 6650168 | 18323 | -4.496 | -0.2810 | Yes | ||
| 18 | CD3E | 3800056 | 18384 | -4.904 | -0.1552 | Yes | ||
| 19 | CD3G | 2680288 | 18515 | -6.372 | 0.0054 | Yes |

