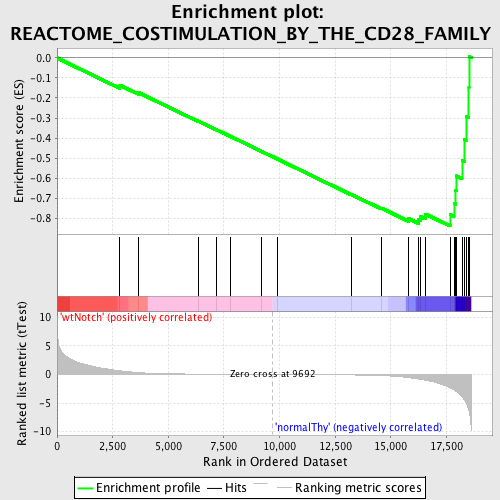
Profile of the Running ES Score & Positions of GeneSet Members on the Rank Ordered List
| Dataset | Set_03_wtNotch_versus_normalThy.phenotype_wtNotch_versus_normalThy.cls #wtNotch_versus_normalThy.phenotype_wtNotch_versus_normalThy.cls #wtNotch_versus_normalThy_repos |
| Phenotype | phenotype_wtNotch_versus_normalThy.cls#wtNotch_versus_normalThy_repos |
| Upregulated in class | normalThy |
| GeneSet | REACTOME_COSTIMULATION_BY_THE_CD28_FAMILY |
| Enrichment Score (ES) | -0.83906937 |
| Normalized Enrichment Score (NES) | -1.6716908 |
| Nominal p-value | 0.0 |
| FDR q-value | 0.04777466 |
| FWER p-Value | 0.264 |
| PROBE | DESCRIPTION (from dataset) | GENE SYMBOL | GENE_TITLE | RANK IN GENE LIST | RANK METRIC SCORE | RUNNING ES | CORE ENRICHMENT | |
|---|---|---|---|---|---|---|---|---|
| 1 | CD80 | 870112 | 2822 | 0.650 | -0.1361 | No | ||
| 2 | PDCD1 | 4120082 | 3667 | 0.333 | -0.1734 | No | ||
| 3 | GRAP2 | 7100441 1410647 | 6376 | 0.065 | -0.3175 | No | ||
| 4 | PIK3R1 | 4730671 | 7165 | 0.043 | -0.3588 | No | ||
| 5 | AKT1 | 5290746 | 7808 | 0.031 | -0.3926 | No | ||
| 6 | PTPN11 | 2230100 2470180 6100528 | 9168 | 0.008 | -0.4655 | No | ||
| 7 | PIK3CA | 6220129 | 9883 | -0.003 | -0.5038 | No | ||
| 8 | PAK1 | 4540315 | 13219 | -0.075 | -0.6813 | No | ||
| 9 | ICOSLG | 70128 | 14566 | -0.175 | -0.7495 | No | ||
| 10 | CD86 | 3390471 6200280 | 15804 | -0.543 | -0.8029 | No | ||
| 11 | MAP3K8 | 2940286 | 16231 | -0.789 | -0.8068 | Yes | ||
| 12 | FYN | 2100468 4760520 4850687 | 16323 | -0.850 | -0.7911 | Yes | ||
| 13 | CSK | 6350593 | 16555 | -0.997 | -0.7794 | Yes | ||
| 14 | LCK | 3360142 | 17665 | -2.357 | -0.7821 | Yes | ||
| 15 | CD28 | 1400739 4210093 | 17840 | -2.716 | -0.7258 | Yes | ||
| 16 | VAV1 | 6020487 | 17923 | -2.904 | -0.6600 | Yes | ||
| 17 | CD3D | 2810739 | 17940 | -2.964 | -0.5893 | Yes | ||
| 18 | CD4 | 1090010 | 18200 | -3.836 | -0.5105 | Yes | ||
| 19 | PDPK1 | 6650168 | 18323 | -4.496 | -0.4084 | Yes | ||
| 20 | CD3E | 3800056 | 18384 | -4.904 | -0.2931 | Yes | ||
| 21 | CTLA4 | 6590537 | 18511 | -6.266 | -0.1484 | Yes | ||
| 22 | CD3G | 2680288 | 18515 | -6.372 | 0.0054 | Yes |

