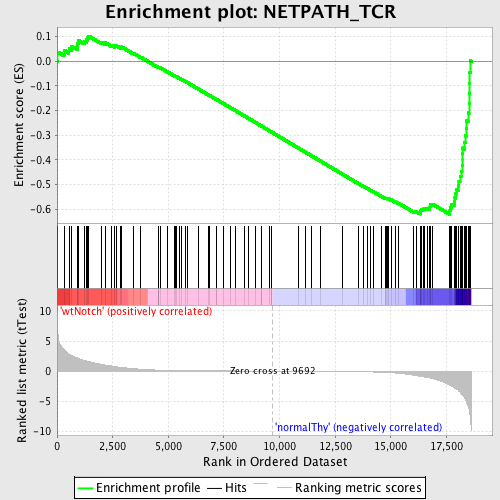
Profile of the Running ES Score & Positions of GeneSet Members on the Rank Ordered List
| Dataset | Set_03_wtNotch_versus_normalThy.phenotype_wtNotch_versus_normalThy.cls #wtNotch_versus_normalThy.phenotype_wtNotch_versus_normalThy.cls #wtNotch_versus_normalThy_repos |
| Phenotype | phenotype_wtNotch_versus_normalThy.cls#wtNotch_versus_normalThy_repos |
| Upregulated in class | normalThy |
| GeneSet | NETPATH_TCR |
| Enrichment Score (ES) | -0.6217178 |
| Normalized Enrichment Score (NES) | -1.6007829 |
| Nominal p-value | 0.0 |
| FDR q-value | 0.1002886 |
| FWER p-Value | 0.749 |
| PROBE | DESCRIPTION (from dataset) | GENE SYMBOL | GENE_TITLE | RANK IN GENE LIST | RANK METRIC SCORE | RUNNING ES | CORE ENRICHMENT | |
|---|---|---|---|---|---|---|---|---|
| 1 | CEBPB | 2970019 | 35 | 6.268 | 0.0375 | No | ||
| 2 | UNC119 | 360372 | 318 | 3.537 | 0.0445 | No | ||
| 3 | NCL | 2360463 4540279 | 534 | 2.844 | 0.0507 | No | ||
| 4 | PIK3R2 | 1660193 | 656 | 2.603 | 0.0606 | No | ||
| 5 | STAT5A | 2680458 | 905 | 2.165 | 0.0608 | No | ||
| 6 | PTK2 | 1780148 | 928 | 2.143 | 0.0731 | No | ||
| 7 | GRB2 | 6650398 | 957 | 2.091 | 0.0847 | No | ||
| 8 | DTX1 | 5900372 | 1220 | 1.795 | 0.0818 | No | ||
| 9 | PTPRC | 130402 5290148 | 1316 | 1.706 | 0.0874 | No | ||
| 10 | JAK3 | 70347 3290008 | 1371 | 1.655 | 0.0949 | No | ||
| 11 | YWHAQ | 6760524 | 1422 | 1.603 | 0.1023 | No | ||
| 12 | ABL1 | 1050593 2030050 4010114 | 2011 | 1.099 | 0.0774 | No | ||
| 13 | ARHGEF6 | 4780164 6380450 | 2156 | 1.003 | 0.0759 | No | ||
| 14 | DBNL | 7100088 | 2437 | 0.858 | 0.0662 | No | ||
| 15 | CDC42 | 1240168 3440278 4480519 5290162 | 2599 | 0.760 | 0.0623 | No | ||
| 16 | HOMER3 | 3830279 | 2675 | 0.725 | 0.0628 | No | ||
| 17 | SOS2 | 2060722 | 2853 | 0.638 | 0.0572 | No | ||
| 18 | SHB | 4920494 | 2904 | 0.615 | 0.0584 | No | ||
| 19 | ZAP70 | 1410494 2260504 | 3430 | 0.417 | 0.0326 | No | ||
| 20 | SH2D3C | 3060014 | 3756 | 0.306 | 0.0170 | No | ||
| 21 | ENAH | 1690292 5700300 | 4552 | 0.174 | -0.0249 | No | ||
| 22 | DUSP3 | 1240129 6840215 | 4555 | 0.173 | -0.0239 | No | ||
| 23 | DLG1 | 2630091 6020286 | 4577 | 0.171 | -0.0239 | No | ||
| 24 | SOS1 | 7050338 | 4633 | 0.165 | -0.0259 | No | ||
| 25 | STK39 | 50692 | 4982 | 0.133 | -0.0438 | No | ||
| 26 | INSL3 | 4150092 | 5258 | 0.115 | -0.0580 | No | ||
| 27 | RIPK2 | 5050072 6290632 | 5335 | 0.111 | -0.0614 | No | ||
| 28 | NFATC2 | 70450 540097 | 5380 | 0.108 | -0.0631 | No | ||
| 29 | RAPGEF1 | 60040 4590670 | 5505 | 0.101 | -0.0691 | No | ||
| 30 | CREB1 | 1500717 2230358 3610600 6550601 | 5595 | 0.097 | -0.0733 | No | ||
| 31 | LYN | 6040600 | 5783 | 0.087 | -0.0829 | No | ||
| 32 | RASA1 | 1240315 | 5862 | 0.084 | -0.0866 | No | ||
| 33 | GRAP2 | 7100441 1410647 | 6376 | 0.065 | -0.1139 | No | ||
| 34 | PTPRH | 3870070 | 6804 | 0.052 | -0.1366 | No | ||
| 35 | PTPRJ | 4010707 | 6828 | 0.051 | -0.1375 | No | ||
| 36 | PIK3R1 | 4730671 | 7165 | 0.043 | -0.1554 | No | ||
| 37 | PTPN22 | 1690647 7100239 | 7171 | 0.043 | -0.1554 | No | ||
| 38 | TUBB2A | 6940435 | 7470 | 0.037 | -0.1713 | No | ||
| 39 | AKT1 | 5290746 | 7808 | 0.031 | -0.1893 | No | ||
| 40 | PTPN3 | 870369 | 8020 | 0.027 | -0.2005 | No | ||
| 41 | MAP2K1 | 840739 | 8442 | 0.019 | -0.2231 | No | ||
| 42 | TXK | 2320338 | 8603 | 0.017 | -0.2317 | No | ||
| 43 | CBLB | 3520465 4670348 | 8912 | 0.012 | -0.2482 | No | ||
| 44 | PTPN11 | 2230100 2470180 6100528 | 9168 | 0.008 | -0.2620 | No | ||
| 45 | PRKCQ | 2260170 3870193 | 9201 | 0.007 | -0.2636 | No | ||
| 46 | GAB2 | 1410280 2340520 4280040 | 9538 | 0.002 | -0.2818 | No | ||
| 47 | SKAP2 | 6760500 | 9627 | 0.001 | -0.2865 | No | ||
| 48 | NCK1 | 6200575 6510050 | 9651 | 0.001 | -0.2878 | No | ||
| 49 | CD2AP | 1940369 | 10862 | -0.017 | -0.3530 | No | ||
| 50 | SRC | 580132 | 11142 | -0.022 | -0.3679 | No | ||
| 51 | RAP1A | 1090025 | 11445 | -0.027 | -0.3841 | No | ||
| 52 | ACP1 | 1990435 | 11842 | -0.035 | -0.4053 | No | ||
| 53 | PLCG1 | 6020369 | 12826 | -0.060 | -0.4580 | No | ||
| 54 | ARHGEF7 | 1690441 | 13544 | -0.090 | -0.4961 | No | ||
| 55 | SYK | 6940133 | 13785 | -0.106 | -0.5085 | No | ||
| 56 | WIPF1 | 1170577 | 13929 | -0.115 | -0.5155 | No | ||
| 57 | ABI1 | 2850152 | 14087 | -0.128 | -0.5231 | No | ||
| 58 | SHC1 | 2900731 3170504 6520537 | 14198 | -0.138 | -0.5282 | No | ||
| 59 | JUN | 840170 | 14564 | -0.175 | -0.5468 | No | ||
| 60 | PAG1 | 5910397 | 14768 | -0.208 | -0.5565 | No | ||
| 61 | DNM2 | 50176 3170279 | 14772 | -0.208 | -0.5553 | No | ||
| 62 | STAT5B | 6200026 | 14806 | -0.214 | -0.5558 | No | ||
| 63 | MAPK1 | 3190193 6200253 | 14867 | -0.227 | -0.5576 | No | ||
| 64 | GRAP | 1770195 | 14887 | -0.231 | -0.5572 | No | ||
| 65 | FOS | 1850315 | 15011 | -0.260 | -0.5622 | No | ||
| 66 | PTPN12 | 2030309 6020725 6130746 6290609 | 15202 | -0.309 | -0.5705 | No | ||
| 67 | CREBBP | 5690035 7040050 | 15330 | -0.349 | -0.5752 | No | ||
| 68 | VAV3 | 1050731 2450242 2680653 | 16036 | -0.671 | -0.6090 | No | ||
| 69 | LCP2 | 2680066 6650707 | 16159 | -0.742 | -0.6110 | No | ||
| 70 | FYN | 2100468 4760520 4850687 | 16323 | -0.850 | -0.6144 | Yes | ||
| 71 | VASP | 7050500 | 16343 | -0.863 | -0.6100 | Yes | ||
| 72 | MAP4K1 | 4060692 | 16352 | -0.869 | -0.6050 | Yes | ||
| 73 | PTPN6 | 4230128 | 16387 | -0.891 | -0.6012 | Yes | ||
| 74 | WAS | 5270193 | 16461 | -0.938 | -0.5993 | Yes | ||
| 75 | CRK | 1230162 4780128 | 16534 | -0.989 | -0.5970 | Yes | ||
| 76 | LAT | 3170025 | 16642 | -1.039 | -0.5962 | Yes | ||
| 77 | KHDRBS1 | 1240403 6040040 | 16724 | -1.107 | -0.5936 | Yes | ||
| 78 | FYB | 1690440 | 16760 | -1.136 | -0.5884 | Yes | ||
| 79 | GIT2 | 6040039 6770181 | 16766 | -1.141 | -0.5815 | Yes | ||
| 80 | ARHGDIB | 4730433 | 16872 | -1.224 | -0.5795 | Yes | ||
| 81 | DOCK2 | 2940040 | 17655 | -2.342 | -0.6070 | Yes | ||
| 82 | LCK | 3360142 | 17665 | -2.357 | -0.5927 | Yes | ||
| 83 | SH3BP2 | 610131 | 17723 | -2.463 | -0.5803 | Yes | ||
| 84 | SLA | 2000070 | 17846 | -2.731 | -0.5697 | Yes | ||
| 85 | TUBA4A | 6900279 | 17881 | -2.792 | -0.5540 | Yes | ||
| 86 | VAV1 | 6020487 | 17923 | -2.904 | -0.5380 | Yes | ||
| 87 | CD3D | 2810739 | 17940 | -2.964 | -0.5202 | Yes | ||
| 88 | BCL10 | 2360397 | 18036 | -3.190 | -0.5053 | Yes | ||
| 89 | CBL | 6380068 | 18061 | -3.305 | -0.4858 | Yes | ||
| 90 | SH2D2A | 2970594 | 18110 | -3.466 | -0.4666 | Yes | ||
| 91 | WASF2 | 4850592 | 18159 | -3.677 | -0.4461 | Yes | ||
| 92 | CD4 | 1090010 | 18200 | -3.836 | -0.4242 | Yes | ||
| 93 | NEDD9 | 1740373 4230053 | 18207 | -3.858 | -0.4003 | Yes | ||
| 94 | CRKL | 4050427 | 18209 | -3.866 | -0.3760 | Yes | ||
| 95 | EVL | 1740113 | 18214 | -3.894 | -0.3518 | Yes | ||
| 96 | PSTPIP1 | 3190156 | 18311 | -4.432 | -0.3291 | Yes | ||
| 97 | CARD11 | 70338 | 18353 | -4.684 | -0.3019 | Yes | ||
| 98 | CD3E | 3800056 | 18384 | -4.904 | -0.2727 | Yes | ||
| 99 | DEF6 | 840593 | 18398 | -5.008 | -0.2419 | Yes | ||
| 100 | CISH | 840315 | 18477 | -5.810 | -0.2096 | Yes | ||
| 101 | CD3G | 2680288 | 18515 | -6.372 | -0.1716 | Yes | ||
| 102 | PTK2B | 4730411 | 18521 | -6.456 | -0.1313 | Yes | ||
| 103 | CD247 | 3800725 5720136 | 18546 | -6.975 | -0.0888 | Yes | ||
| 104 | ITK | 2230592 | 18551 | -7.151 | -0.0440 | Yes | ||
| 105 | CD5 | 6590338 | 18568 | -7.559 | 0.0026 | Yes |

