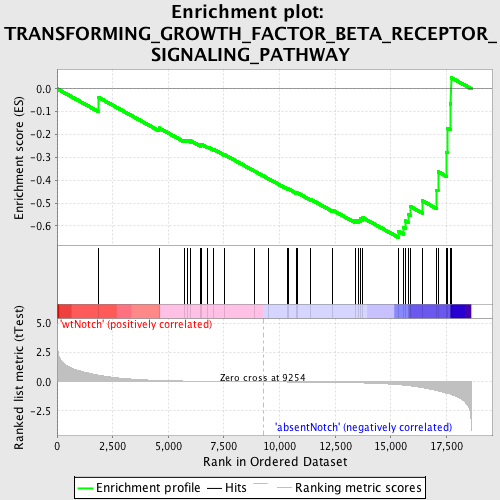
Profile of the Running ES Score & Positions of GeneSet Members on the Rank Ordered List
| Dataset | Set_03_absentNotch_versus_wtNotch.phenotype_absentNotch_versus_wtNotch.cls #wtNotch_versus_absentNotch |
| Phenotype | phenotype_absentNotch_versus_wtNotch.cls#wtNotch_versus_absentNotch |
| Upregulated in class | absentNotch |
| GeneSet | TRANSFORMING_GROWTH_FACTOR_BETA_RECEPTOR_SIGNALING_PATHWAY |
| Enrichment Score (ES) | -0.65078735 |
| Normalized Enrichment Score (NES) | -1.5619477 |
| Nominal p-value | 0.010810811 |
| FDR q-value | 0.93363935 |
| FWER p-Value | 0.998 |

| PROBE | DESCRIPTION (from dataset) | GENE SYMBOL | GENE_TITLE | RANK IN GENE LIST | RANK METRIC SCORE | RUNNING ES | CORE ENRICHMENT | |
|---|---|---|---|---|---|---|---|---|
| 1 | FNTA | 70059 | 1852 | 0.579 | -0.0373 | No | ||
| 2 | TGFBR1 | 1400148 4280020 6550711 | 4580 | 0.118 | -0.1713 | No | ||
| 3 | FOXH1 | 2060180 | 5706 | 0.067 | -0.2246 | No | ||
| 4 | IL17F | 670577 | 5850 | 0.062 | -0.2256 | No | ||
| 5 | GDF10 | 4850082 | 6015 | 0.057 | -0.2283 | No | ||
| 6 | ENG | 4280270 | 6439 | 0.047 | -0.2460 | No | ||
| 7 | FMOD | 540577 | 6490 | 0.046 | -0.2438 | No | ||
| 8 | GDF5 | 510440 | 6775 | 0.039 | -0.2548 | No | ||
| 9 | KLF10 | 4850056 | 7040 | 0.034 | -0.2653 | No | ||
| 10 | SMAD7 | 430377 | 7519 | 0.026 | -0.2882 | No | ||
| 11 | TGFBR3 | 5290577 | 8891 | 0.005 | -0.3615 | No | ||
| 12 | GDF9 | 2350181 | 9517 | -0.004 | -0.3947 | No | ||
| 13 | LEFTY2 | 5670364 | 10346 | -0.015 | -0.4376 | No | ||
| 14 | SNX6 | 6200086 | 10390 | -0.016 | -0.4382 | No | ||
| 15 | TGFB1 | 1940162 | 10755 | -0.021 | -0.4555 | No | ||
| 16 | CIDEA | 4560020 | 10797 | -0.022 | -0.4553 | No | ||
| 17 | ACVRL1 | 3290600 | 11411 | -0.032 | -0.4848 | No | ||
| 18 | HIPK2 | 6350647 | 12386 | -0.053 | -0.5315 | No | ||
| 19 | LTBP2 | 4850039 | 13395 | -0.084 | -0.5767 | No | ||
| 20 | GDF15 | 4730017 | 13560 | -0.091 | -0.5757 | No | ||
| 21 | SMAD2 | 4200592 | 13635 | -0.094 | -0.5695 | No | ||
| 22 | MAP3K7 | 6040068 | 13743 | -0.099 | -0.5646 | No | ||
| 23 | ZFYVE9 | 6980288 7100017 | 15345 | -0.245 | -0.6244 | Yes | ||
| 24 | CDKN2B | 6020040 | 15576 | -0.285 | -0.6060 | Yes | ||
| 25 | ACVR1 | 6840671 | 15654 | -0.301 | -0.5777 | Yes | ||
| 26 | BMPR1A | 2190193 4060603 | 15801 | -0.335 | -0.5495 | Yes | ||
| 27 | HPGD | 6770192 | 15892 | -0.355 | -0.5160 | Yes | ||
| 28 | CITED2 | 5670114 5130088 | 16426 | -0.502 | -0.4906 | Yes | ||
| 29 | EID2 | 3130176 | 17057 | -0.751 | -0.4436 | Yes | ||
| 30 | SMAD3 | 6450671 | 17125 | -0.778 | -0.3633 | Yes | ||
| 31 | STUB1 | 5860086 | 17516 | -0.985 | -0.2781 | Yes | ||
| 32 | CDKN1C | 6520577 | 17550 | -0.999 | -0.1722 | Yes | ||
| 33 | SMAD4 | 5670519 | 17673 | -1.053 | -0.0652 | Yes | ||
| 34 | LEFTY1 | 3290452 | 17704 | -1.075 | 0.0491 | Yes |

