Profile of the Running ES Score & Positions of GeneSet Members on the Rank Ordered List
| Dataset | Set_03_absentNotch_versus_wtNotch.phenotype_absentNotch_versus_wtNotch.cls #wtNotch_versus_absentNotch |
| Phenotype | phenotype_absentNotch_versus_wtNotch.cls#wtNotch_versus_absentNotch |
| Upregulated in class | absentNotch |
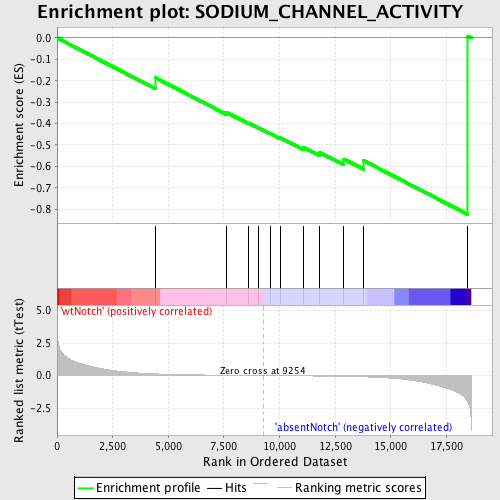
| GeneSet | SODIUM_CHANNEL_ACTIVITY |
| Enrichment Score (ES) | -0.8245451 |
| Normalized Enrichment Score (NES) | -1.5897707 |
| Nominal p-value | 0.0111524165 |
| FDR q-value | 1.0 |
| FWER p-Value | 0.986 |
| PROBE | DESCRIPTION (from dataset) | GENE SYMBOL | GENE_TITLE | RANK IN GENE LIST | RANK METRIC SCORE | RUNNING ES | CORE ENRICHMENT | |
|---|---|---|---|---|---|---|---|---|
| 1 | SCN7A | 2510538 | 4429 | 0.127 | -0.1863 | No | ||
| 2 | SCN9A | 5270575 | 7607 | 0.024 | -0.3472 | No | ||
| 3 | SCN4A | 5340687 | 8623 | 0.009 | -0.3982 | No | ||
| 4 | SCN1B | 1240022 2120048 | 9051 | 0.003 | -0.4200 | No | ||
| 5 | SCN11A | 2480372 | 9573 | -0.004 | -0.4463 | No | ||
| 6 | PKD2 | 4670390 | 10035 | -0.011 | -0.4666 | No | ||
| 7 | SCNN1G | 520600 | 11074 | -0.027 | -0.5116 | No | ||
| 8 | ACCN1 | 2060139 2190541 | 11793 | -0.040 | -0.5341 | No | ||
| 9 | CACNA1S | 4730465 | 12882 | -0.066 | -0.5657 | No | ||
| 10 | SCNN1B | 5390377 | 13789 | -0.101 | -0.5734 | Yes | ||
| 11 | SCN5A | 4070017 | 18462 | -2.053 | 0.0083 | Yes |

