Profile of the Running ES Score & Positions of GeneSet Members on the Rank Ordered List
| Dataset | Set_03_absentNotch_versus_wtNotch.phenotype_absentNotch_versus_wtNotch.cls #wtNotch_versus_absentNotch |
| Phenotype | phenotype_absentNotch_versus_wtNotch.cls#wtNotch_versus_absentNotch |
| Upregulated in class | absentNotch |
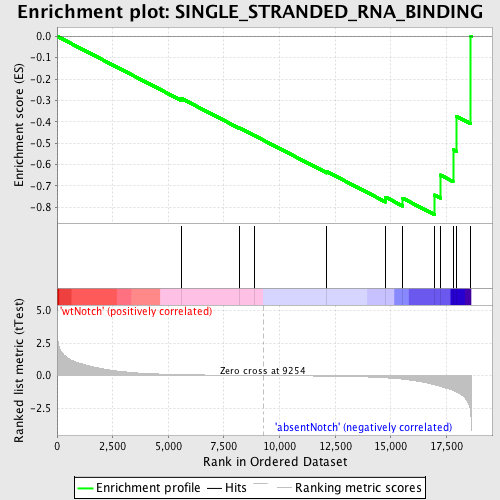
| GeneSet | SINGLE_STRANDED_RNA_BINDING |
| Enrichment Score (ES) | -0.83391434 |
| Normalized Enrichment Score (NES) | -1.5639338 |
| Nominal p-value | 0.01968504 |
| FDR q-value | 1.0 |
| FWER p-Value | 0.997 |
| PROBE | DESCRIPTION (from dataset) | GENE SYMBOL | GENE_TITLE | RANK IN GENE LIST | RANK METRIC SCORE | RUNNING ES | CORE ENRICHMENT | |
|---|---|---|---|---|---|---|---|---|
| 1 | TLR7 | 3140300 | 5574 | 0.072 | -0.2902 | No | ||
| 2 | TLR8 | 1240092 | 8193 | 0.015 | -0.4289 | No | ||
| 3 | ADARB2 | 2190170 | 8864 | 0.005 | -0.4643 | No | ||
| 4 | TIA1 | 4670373 | 12130 | -0.047 | -0.6337 | No | ||
| 5 | PABPC4 | 1990170 6760270 5390138 | 14772 | -0.171 | -0.7533 | No | ||
| 6 | ATXN1 | 5550156 | 15540 | -0.278 | -0.7581 | Yes | ||
| 7 | HNRPH1 | 1170086 3140546 3290471 6110184 6110373 | 16951 | -0.698 | -0.7426 | Yes | ||
| 8 | EIF4A3 | 3440538 | 17221 | -0.827 | -0.6490 | Yes | ||
| 9 | PABPC1 | 2650180 2690253 6020632 1990270 | 17797 | -1.149 | -0.5299 | Yes | ||
| 10 | ZFP36 | 2030605 | 17941 | -1.248 | -0.3744 | Yes | ||
| 11 | HNRPDL | 1050102 1090181 5360471 | 18599 | -3.143 | 0.0009 | Yes |

