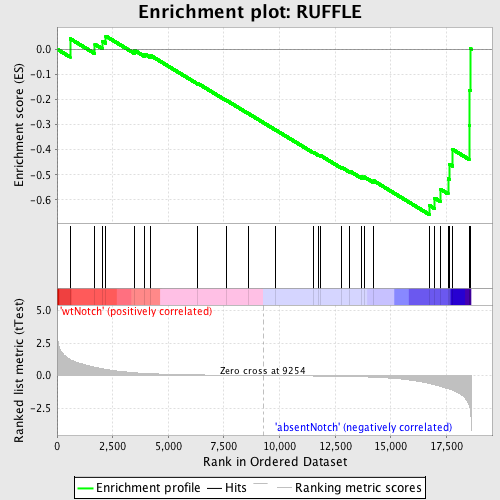
Profile of the Running ES Score & Positions of GeneSet Members on the Rank Ordered List
| Dataset | Set_03_absentNotch_versus_wtNotch.phenotype_absentNotch_versus_wtNotch.cls #wtNotch_versus_absentNotch |
| Phenotype | phenotype_absentNotch_versus_wtNotch.cls#wtNotch_versus_absentNotch |
| Upregulated in class | absentNotch |
| GeneSet | RUFFLE |
| Enrichment Score (ES) | -0.65829986 |
| Normalized Enrichment Score (NES) | -1.5480428 |
| Nominal p-value | 0.018484289 |
| FDR q-value | 0.70976424 |
| FWER p-Value | 0.999 |
| PROBE | DESCRIPTION (from dataset) | GENE SYMBOL | GENE_TITLE | RANK IN GENE LIST | RANK METRIC SCORE | RUNNING ES | CORE ENRICHMENT | |
|---|---|---|---|---|---|---|---|---|
| 1 | ARFIP2 | 1850301 4670180 | 584 | 1.232 | 0.0419 | No | ||
| 2 | MYH9 | 3120091 4850292 | 1700 | 0.628 | 0.0193 | No | ||
| 3 | TLN1 | 6590411 | 2043 | 0.517 | 0.0316 | No | ||
| 4 | ALS2 | 3130546 6400070 | 2190 | 0.474 | 0.0520 | No | ||
| 5 | FGD3 | 5690465 | 3493 | 0.213 | -0.0054 | No | ||
| 6 | MYO5A | 2900288 5270333 | 3936 | 0.167 | -0.0192 | No | ||
| 7 | FGD6 | 610632 | 4213 | 0.142 | -0.0256 | No | ||
| 8 | S100B | 6520088 | 6331 | 0.049 | -0.1366 | No | ||
| 9 | FGD4 | 520168 870411 2640253 6550338 6650364 | 7618 | 0.024 | -0.2043 | No | ||
| 10 | CD2AP | 1940369 | 8614 | 0.009 | -0.2573 | No | ||
| 11 | FGD5 | 3520438 4060500 | 9822 | -0.008 | -0.3218 | No | ||
| 12 | FGD1 | 4780021 | 11513 | -0.034 | -0.4107 | No | ||
| 13 | ITGB1BP1 | 3830121 | 11768 | -0.039 | -0.4220 | No | ||
| 14 | BCAR1 | 1340215 | 11859 | -0.041 | -0.4244 | No | ||
| 15 | ITGA5 | 5550520 | 12796 | -0.064 | -0.4710 | No | ||
| 16 | PIB5PA | 6900427 | 13163 | -0.076 | -0.4861 | No | ||
| 17 | FGD2 | 5340195 | 13676 | -0.096 | -0.5080 | No | ||
| 18 | S100A11 | 2260064 | 13805 | -0.102 | -0.5088 | No | ||
| 19 | CTTN | 780154 1690538 3310017 4060717 | 14239 | -0.128 | -0.5245 | No | ||
| 20 | CDK6 | 4920253 | 16728 | -0.610 | -0.6220 | Yes | ||
| 21 | MYO6 | 2190332 | 16973 | -0.707 | -0.5930 | Yes | ||
| 22 | PDPN | 4640280 | 17220 | -0.827 | -0.5571 | Yes | ||
| 23 | NME2 | 2190672 | 17574 | -1.002 | -0.5164 | Yes | ||
| 24 | S100A6 | 1690204 | 17636 | -1.028 | -0.4585 | Yes | ||
| 25 | ARF6 | 3520026 | 17773 | -1.123 | -0.3990 | Yes | ||
| 26 | CYFIP1 | 5690082 | 18521 | -2.260 | -0.3047 | Yes | ||
| 27 | TESC | 6550273 | 18542 | -2.385 | -0.1638 | Yes | ||
| 28 | ITGB1 | 5080156 6270528 | 18580 | -2.818 | 0.0019 | Yes |

