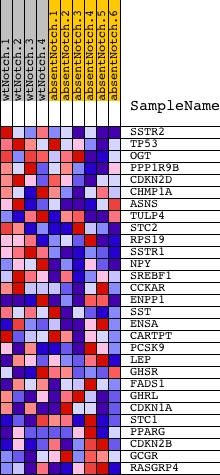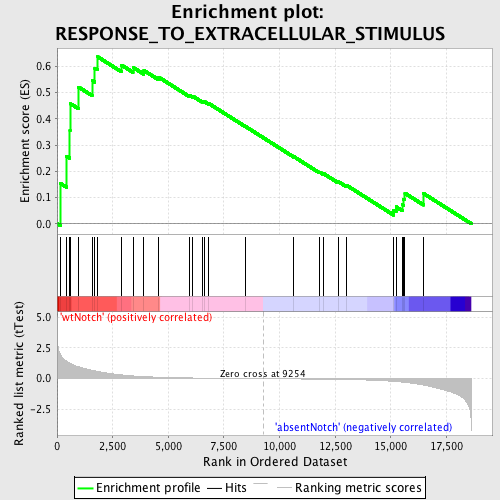
Profile of the Running ES Score & Positions of GeneSet Members on the Rank Ordered List
| Dataset | Set_03_absentNotch_versus_wtNotch.phenotype_absentNotch_versus_wtNotch.cls #wtNotch_versus_absentNotch |
| Phenotype | phenotype_absentNotch_versus_wtNotch.cls#wtNotch_versus_absentNotch |
| Upregulated in class | wtNotch |
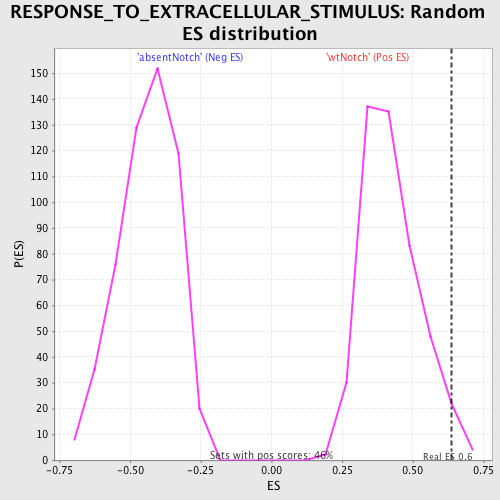
| GeneSet | RESPONSE_TO_EXTRACELLULAR_STIMULUS |
| Enrichment Score (ES) | 0.6367418 |
| Normalized Enrichment Score (NES) | 1.5119205 |
| Nominal p-value | 0.019522777 |
| FDR q-value | 1.0 |
| FWER p-Value | 1.0 |
| PROBE | DESCRIPTION (from dataset) | GENE SYMBOL | GENE_TITLE | RANK IN GENE LIST | RANK METRIC SCORE | RUNNING ES | CORE ENRICHMENT | |
|---|---|---|---|---|---|---|---|---|
| 1 | SSTR2 | 4590687 | 159 | 1.902 | 0.1534 | Yes | ||
| 2 | TP53 | 6130707 | 432 | 1.390 | 0.2571 | Yes | ||
| 3 | OGT | 2360131 4610333 | 577 | 1.238 | 0.3548 | Yes | ||
| 4 | PPP1R9B | 3130619 | 585 | 1.227 | 0.4589 | Yes | ||
| 5 | CDKN2D | 6040035 | 969 | 0.974 | 0.5212 | Yes | ||
| 6 | CHMP1A | 5550441 | 1575 | 0.682 | 0.5467 | Yes | ||
| 7 | ASNS | 110368 7100687 | 1696 | 0.630 | 0.5939 | Yes | ||
| 8 | TULP4 | 2320364 | 1828 | 0.586 | 0.6367 | Yes | ||
| 9 | STC2 | 4920601 | 2899 | 0.306 | 0.6052 | No | ||
| 10 | RPS19 | 5860066 | 3413 | 0.223 | 0.5966 | No | ||
| 11 | SSTR1 | 2630471 | 3901 | 0.170 | 0.5848 | No | ||
| 12 | NPY | 3170138 | 4568 | 0.119 | 0.5591 | No | ||
| 13 | SREBF1 | 4780333 | 5934 | 0.060 | 0.4908 | No | ||
| 14 | CCKAR | 4210079 | 6100 | 0.055 | 0.4866 | No | ||
| 15 | ENPP1 | 780609 | 6544 | 0.044 | 0.4665 | No | ||
| 16 | SST | 6590142 | 6615 | 0.043 | 0.4664 | No | ||
| 17 | ENSA | 6620546 | 6816 | 0.039 | 0.4589 | No | ||
| 18 | CARTPT | 6660687 | 8455 | 0.011 | 0.3718 | No | ||
| 19 | PCSK9 | 3120044 | 10646 | -0.020 | 0.2557 | No | ||
| 20 | LEP | 4010053 | 11801 | -0.040 | 0.1970 | No | ||
| 21 | GHSR | 1980465 7050521 | 11959 | -0.043 | 0.1922 | No | ||
| 22 | FADS1 | 5270537 | 12633 | -0.059 | 0.1610 | No | ||
| 23 | GHRL | 2360619 6760438 | 13015 | -0.071 | 0.1465 | No | ||
| 24 | CDKN1A | 4050088 6400706 | 15127 | -0.212 | 0.0510 | No | ||
| 25 | STC1 | 360161 | 15239 | -0.228 | 0.0645 | No | ||
| 26 | PPARG | 1990168 2680603 6130632 | 15518 | -0.276 | 0.0730 | No | ||
| 27 | CDKN2B | 6020040 | 15576 | -0.285 | 0.0942 | No | ||
| 28 | GCGR | 6620497 | 15635 | -0.297 | 0.1164 | No | ||
| 29 | RASGRP4 | 540102 | 16473 | -0.516 | 0.1153 | No |