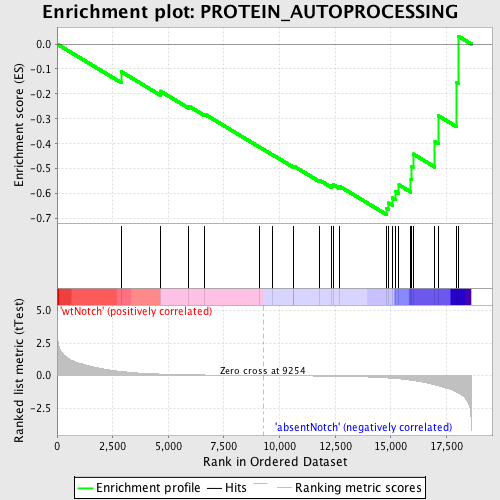
Profile of the Running ES Score & Positions of GeneSet Members on the Rank Ordered List
| Dataset | Set_03_absentNotch_versus_wtNotch.phenotype_absentNotch_versus_wtNotch.cls #wtNotch_versus_absentNotch |
| Phenotype | phenotype_absentNotch_versus_wtNotch.cls#wtNotch_versus_absentNotch |
| Upregulated in class | absentNotch |
| GeneSet | PROTEIN_AUTOPROCESSING |
| Enrichment Score (ES) | -0.6838473 |
| Normalized Enrichment Score (NES) | -1.5534043 |
| Nominal p-value | 0.020676691 |
| FDR q-value | 0.91297996 |
| FWER p-Value | 0.999 |
| PROBE | DESCRIPTION (from dataset) | GENE SYMBOL | GENE_TITLE | RANK IN GENE LIST | RANK METRIC SCORE | RUNNING ES | CORE ENRICHMENT | |
|---|---|---|---|---|---|---|---|---|
| 1 | EIF2AK3 | 4280161 | 2884 | 0.308 | -0.1110 | No | ||
| 2 | MAP3K11 | 7000039 | 4629 | 0.115 | -0.1884 | No | ||
| 3 | CDKL5 | 2450070 | 5912 | 0.060 | -0.2487 | No | ||
| 4 | TTN | 2320161 4670056 6550026 | 6641 | 0.042 | -0.2818 | No | ||
| 5 | AKT1 | 5290746 | 9115 | 0.002 | -0.4145 | No | ||
| 6 | MAP3K9 | 3290707 | 9692 | -0.006 | -0.4446 | No | ||
| 7 | MAP3K12 | 2470373 6420162 | 10636 | -0.020 | -0.4925 | No | ||
| 8 | PCSK9 | 3120044 | 10646 | -0.020 | -0.4901 | No | ||
| 9 | MAP3K13 | 3190017 | 11785 | -0.040 | -0.5456 | No | ||
| 10 | MYO3A | 5290494 | 12317 | -0.051 | -0.5669 | No | ||
| 11 | TNK1 | 4730279 | 12409 | -0.053 | -0.5641 | No | ||
| 12 | PAK1 | 4540315 | 12714 | -0.061 | -0.5717 | No | ||
| 13 | LMTK2 | 6650692 | 14800 | -0.174 | -0.6590 | Yes | ||
| 14 | CRKRS | 510537 2510551 | 14903 | -0.187 | -0.6377 | Yes | ||
| 15 | MAP3K3 | 610685 | 15075 | -0.206 | -0.6174 | Yes | ||
| 16 | DYRK1A | 3190181 | 15214 | -0.226 | -0.5924 | Yes | ||
| 17 | INSR | 1190504 | 15366 | -0.247 | -0.5653 | Yes | ||
| 18 | PAK2 | 360438 7050068 | 15904 | -0.358 | -0.5428 | Yes | ||
| 19 | UHMK1 | 3850670 6450064 | 15941 | -0.364 | -0.4926 | Yes | ||
| 20 | MAP3K10 | 3360168 4850180 | 15998 | -0.381 | -0.4410 | Yes | ||
| 21 | CAMKK2 | 5270047 | 16982 | -0.711 | -0.3921 | Yes | ||
| 22 | IGF1R | 3360494 | 17142 | -0.786 | -0.2881 | Yes | ||
| 23 | EIF2AK1 | 2470301 | 17936 | -1.246 | -0.1524 | Yes | ||
| 24 | STK4 | 2640152 | 18025 | -1.319 | 0.0318 | Yes |

