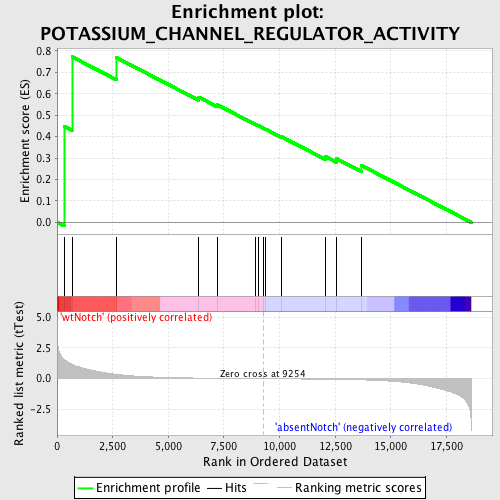
Profile of the Running ES Score & Positions of GeneSet Members on the Rank Ordered List
| Dataset | Set_03_absentNotch_versus_wtNotch.phenotype_absentNotch_versus_wtNotch.cls #wtNotch_versus_absentNotch |
| Phenotype | phenotype_absentNotch_versus_wtNotch.cls#wtNotch_versus_absentNotch |
| Upregulated in class | wtNotch |
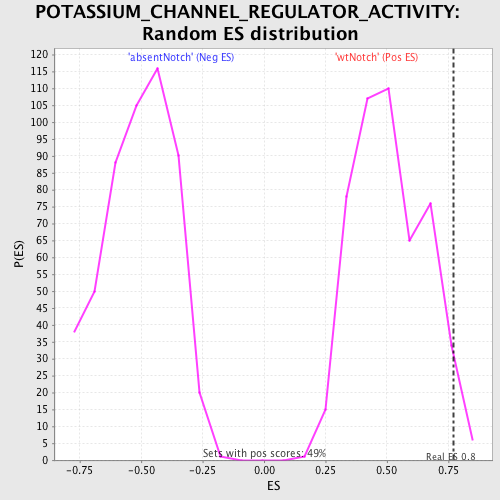
| GeneSet | POTASSIUM_CHANNEL_REGULATOR_ACTIVITY |
| Enrichment Score (ES) | 0.7723582 |
| Normalized Enrichment Score (NES) | 1.5164087 |
| Nominal p-value | 0.028455285 |
| FDR q-value | 1.0 |
| FWER p-Value | 1.0 |
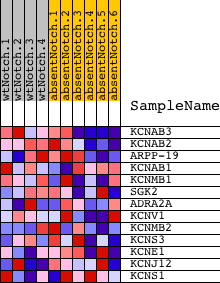
| PROBE | DESCRIPTION (from dataset) | GENE SYMBOL | GENE_TITLE | RANK IN GENE LIST | RANK METRIC SCORE | RUNNING ES | CORE ENRICHMENT | |
|---|---|---|---|---|---|---|---|---|
| 1 | KCNAB3 | 2470725 | 313 | 1.577 | 0.4490 | Yes | ||
| 2 | KCNAB2 | 4850315 | 672 | 1.160 | 0.7724 | Yes | ||
| 3 | ARPP-19 | 5700025 | 2671 | 0.350 | 0.7683 | No | ||
| 4 | KCNAB1 | 1580070 3290156 | 6366 | 0.048 | 0.5840 | No | ||
| 5 | KCNMB1 | 4760139 | 7191 | 0.031 | 0.5490 | No | ||
| 6 | SGK2 | 1850070 | 8931 | 0.004 | 0.4567 | No | ||
| 7 | ADRA2A | 5340520 | 9041 | 0.003 | 0.4517 | No | ||
| 8 | KCNV1 | 6110332 | 9258 | -0.000 | 0.4401 | No | ||
| 9 | KCNMB2 | 3780128 4760136 | 9386 | -0.002 | 0.4338 | No | ||
| 10 | KCNS3 | 4150039 | 10090 | -0.012 | 0.3995 | No | ||
| 11 | KCNE1 | 1230520 1690372 4120050 | 12071 | -0.045 | 0.3063 | No | ||
| 12 | KCNJ12 | 3870364 | 12562 | -0.057 | 0.2968 | No | ||
| 13 | KCNS1 | 2570195 | 13684 | -0.097 | 0.2651 | No |