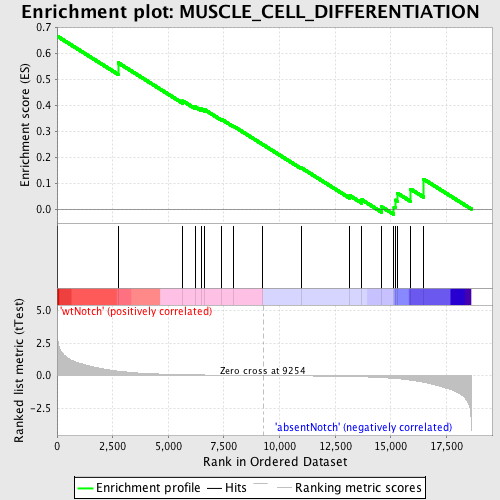
Profile of the Running ES Score & Positions of GeneSet Members on the Rank Ordered List
| Dataset | Set_03_absentNotch_versus_wtNotch.phenotype_absentNotch_versus_wtNotch.cls #wtNotch_versus_absentNotch |
| Phenotype | phenotype_absentNotch_versus_wtNotch.cls#wtNotch_versus_absentNotch |
| Upregulated in class | wtNotch |
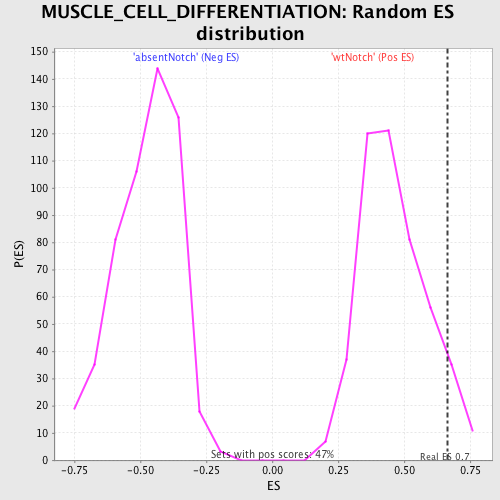
| GeneSet | MUSCLE_CELL_DIFFERENTIATION |
| Enrichment Score (ES) | 0.66571504 |
| Normalized Enrichment Score (NES) | 1.4404341 |
| Nominal p-value | 0.055555556 |
| FDR q-value | 1.0 |
| FWER p-Value | 1.0 |
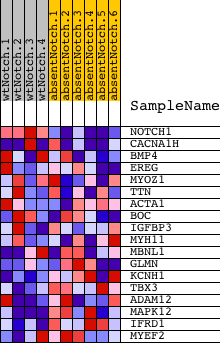
| PROBE | DESCRIPTION (from dataset) | GENE SYMBOL | GENE_TITLE | RANK IN GENE LIST | RANK METRIC SCORE | RUNNING ES | CORE ENRICHMENT | |
|---|---|---|---|---|---|---|---|---|
| 1 | NOTCH1 | 3390114 | 0 | 4.962 | 0.6657 | Yes | ||
| 2 | CACNA1H | 1230279 | 2743 | 0.335 | 0.5632 | No | ||
| 3 | BMP4 | 380113 | 5651 | 0.069 | 0.4162 | No | ||
| 4 | EREG | 50519 4920129 | 6197 | 0.053 | 0.3940 | No | ||
| 5 | MYOZ1 | 2760670 | 6467 | 0.046 | 0.3857 | No | ||
| 6 | TTN | 2320161 4670056 6550026 | 6641 | 0.042 | 0.3820 | No | ||
| 7 | ACTA1 | 840538 | 7389 | 0.028 | 0.3456 | No | ||
| 8 | BOC | 5270348 | 7918 | 0.019 | 0.3198 | No | ||
| 9 | IGFBP3 | 2370500 | 9225 | 0.000 | 0.2496 | No | ||
| 10 | MYH11 | 7100273 | 10984 | -0.025 | 0.1585 | No | ||
| 11 | MBNL1 | 2640762 7100048 | 13161 | -0.075 | 0.0516 | No | ||
| 12 | GLMN | 5290563 5890239 | 13700 | -0.097 | 0.0357 | No | ||
| 13 | KCNH1 | 4070619 6660181 | 14584 | -0.155 | 0.0090 | No | ||
| 14 | TBX3 | 2570672 | 15140 | -0.214 | 0.0079 | No | ||
| 15 | ADAM12 | 3390132 4070347 | 15196 | -0.224 | 0.0350 | No | ||
| 16 | MAPK12 | 450022 1340717 7050484 | 15286 | -0.236 | 0.0618 | No | ||
| 17 | IFRD1 | 4590215 | 15895 | -0.356 | 0.0768 | No | ||
| 18 | MYEF2 | 6860484 | 16475 | -0.517 | 0.1151 | No |