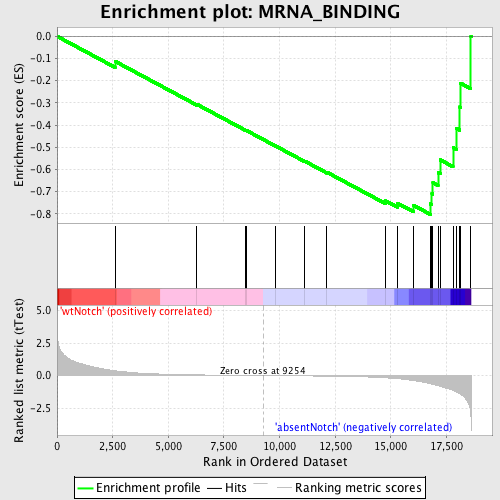
Profile of the Running ES Score & Positions of GeneSet Members on the Rank Ordered List
| Dataset | Set_03_absentNotch_versus_wtNotch.phenotype_absentNotch_versus_wtNotch.cls #wtNotch_versus_absentNotch |
| Phenotype | phenotype_absentNotch_versus_wtNotch.cls#wtNotch_versus_absentNotch |
| Upregulated in class | absentNotch |
| GeneSet | MRNA_BINDING |
| Enrichment Score (ES) | -0.80324626 |
| Normalized Enrichment Score (NES) | -1.7249585 |
| Nominal p-value | 0.0035778175 |
| FDR q-value | 0.36454868 |
| FWER p-Value | 0.3 |
| PROBE | DESCRIPTION (from dataset) | GENE SYMBOL | GENE_TITLE | RANK IN GENE LIST | RANK METRIC SCORE | RUNNING ES | CORE ENRICHMENT | |
|---|---|---|---|---|---|---|---|---|
| 1 | CPSF1 | 6290064 | 2608 | 0.363 | -0.1128 | No | ||
| 2 | SLBP | 6220601 | 6284 | 0.051 | -0.3066 | No | ||
| 3 | ELAVL2 | 360181 | 8471 | 0.011 | -0.4233 | No | ||
| 4 | AUH | 5570152 | 8520 | 0.010 | -0.4252 | No | ||
| 5 | SSB | 460286 3140717 | 9800 | -0.007 | -0.4934 | No | ||
| 6 | FMR1 | 5050075 | 11131 | -0.028 | -0.5628 | No | ||
| 7 | TIA1 | 4670373 | 12130 | -0.047 | -0.6130 | No | ||
| 8 | PABPC4 | 1990170 6760270 5390138 | 14772 | -0.171 | -0.7421 | No | ||
| 9 | ZFP36L1 | 2510138 4120048 | 15294 | -0.236 | -0.7522 | No | ||
| 10 | GRSF1 | 2100184 | 16016 | -0.386 | -0.7618 | Yes | ||
| 11 | ELAVL4 | 50735 3360086 5220167 | 16787 | -0.633 | -0.7555 | Yes | ||
| 12 | RPL35 | 6940070 | 16847 | -0.655 | -0.7092 | Yes | ||
| 13 | PARN | 3840129 | 16892 | -0.676 | -0.6606 | Yes | ||
| 14 | PURB | 5360138 | 17124 | -0.778 | -0.6143 | Yes | ||
| 15 | EIF4A3 | 3440538 | 17221 | -0.827 | -0.5571 | Yes | ||
| 16 | PABPC1 | 2650180 2690253 6020632 1990270 | 17797 | -1.149 | -0.5013 | Yes | ||
| 17 | ZFP36 | 2030605 | 17941 | -1.248 | -0.4148 | Yes | ||
| 18 | EIF4A1 | 1990341 2810300 | 18104 | -1.391 | -0.3186 | Yes | ||
| 19 | HNRPAB | 540504 | 18141 | -1.442 | -0.2117 | Yes | ||
| 20 | HNRPDL | 1050102 1090181 5360471 | 18599 | -3.143 | 0.0009 | Yes |

