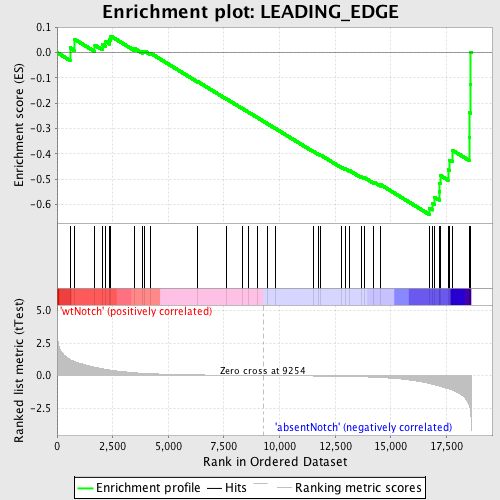
Profile of the Running ES Score & Positions of GeneSet Members on the Rank Ordered List
| Dataset | Set_03_absentNotch_versus_wtNotch.phenotype_absentNotch_versus_wtNotch.cls #wtNotch_versus_absentNotch |
| Phenotype | phenotype_absentNotch_versus_wtNotch.cls#wtNotch_versus_absentNotch |
| Upregulated in class | absentNotch |
| GeneSet | LEADING_EDGE |
| Enrichment Score (ES) | -0.6390221 |
| Normalized Enrichment Score (NES) | -1.5721089 |
| Nominal p-value | 0.009276438 |
| FDR q-value | 1.0 |
| FWER p-Value | 0.994 |
| PROBE | DESCRIPTION (from dataset) | GENE SYMBOL | GENE_TITLE | RANK IN GENE LIST | RANK METRIC SCORE | RUNNING ES | CORE ENRICHMENT | |
|---|---|---|---|---|---|---|---|---|
| 1 | ARFIP2 | 1850301 4670180 | 584 | 1.232 | 0.0188 | No | ||
| 2 | DBNL | 7100088 | 768 | 1.089 | 0.0533 | No | ||
| 3 | MYH9 | 3120091 4850292 | 1700 | 0.628 | 0.0288 | No | ||
| 4 | TLN1 | 6590411 | 2043 | 0.517 | 0.0315 | No | ||
| 5 | ALS2 | 3130546 6400070 | 2190 | 0.474 | 0.0429 | No | ||
| 6 | ABI1 | 2850152 | 2366 | 0.423 | 0.0507 | No | ||
| 7 | TSC1 | 1850672 | 2415 | 0.410 | 0.0648 | No | ||
| 8 | FGD3 | 5690465 | 3493 | 0.213 | 0.0155 | No | ||
| 9 | AMOT | 1940121 2940647 6590093 | 3825 | 0.178 | 0.0050 | No | ||
| 10 | MYO5A | 2900288 5270333 | 3936 | 0.167 | 0.0058 | No | ||
| 11 | FGD6 | 610632 | 4213 | 0.142 | -0.0032 | No | ||
| 12 | S100B | 6520088 | 6331 | 0.049 | -0.1152 | No | ||
| 13 | FGD4 | 520168 870411 2640253 6550338 6650364 | 7618 | 0.024 | -0.1834 | No | ||
| 14 | ABI3 | 1740563 | 8344 | 0.013 | -0.2219 | No | ||
| 15 | CD2AP | 1940369 | 8614 | 0.009 | -0.2361 | No | ||
| 16 | APBB1 | 2690338 | 9011 | 0.003 | -0.2572 | No | ||
| 17 | FAP | 4560019 | 9438 | -0.003 | -0.2801 | No | ||
| 18 | FGD5 | 3520438 4060500 | 9822 | -0.008 | -0.3004 | No | ||
| 19 | FGD1 | 4780021 | 11513 | -0.034 | -0.3900 | No | ||
| 20 | ITGB1BP1 | 3830121 | 11768 | -0.039 | -0.4020 | No | ||
| 21 | BCAR1 | 1340215 | 11859 | -0.041 | -0.4052 | No | ||
| 22 | ITGA5 | 5550520 | 12796 | -0.064 | -0.4530 | No | ||
| 23 | CDC42BPA | 840671 | 12947 | -0.068 | -0.4583 | No | ||
| 24 | PIB5PA | 6900427 | 13163 | -0.076 | -0.4668 | No | ||
| 25 | FGD2 | 5340195 | 13676 | -0.096 | -0.4904 | No | ||
| 26 | S100A11 | 2260064 | 13805 | -0.102 | -0.4932 | No | ||
| 27 | CTTN | 780154 1690538 3310017 4060717 | 14239 | -0.128 | -0.5113 | No | ||
| 28 | APBB2 | 5130403 | 14529 | -0.150 | -0.5207 | No | ||
| 29 | CDK6 | 4920253 | 16728 | -0.610 | -0.6141 | Yes | ||
| 30 | WASF2 | 4850592 | 16863 | -0.665 | -0.5942 | Yes | ||
| 31 | MYO6 | 2190332 | 16973 | -0.707 | -0.5713 | Yes | ||
| 32 | CDC42BPB | 6350037 | 17177 | -0.805 | -0.5494 | Yes | ||
| 33 | EVL | 1740113 | 17197 | -0.818 | -0.5171 | Yes | ||
| 34 | PDPN | 4640280 | 17220 | -0.827 | -0.4846 | Yes | ||
| 35 | NME2 | 2190672 | 17574 | -1.002 | -0.4627 | Yes | ||
| 36 | S100A6 | 1690204 | 17636 | -1.028 | -0.4241 | Yes | ||
| 37 | ARF6 | 3520026 | 17773 | -1.123 | -0.3856 | Yes | ||
| 38 | CYFIP1 | 5690082 | 18521 | -2.260 | -0.3337 | Yes | ||
| 39 | TESC | 6550273 | 18542 | -2.385 | -0.2376 | Yes | ||
| 40 | ITGB1 | 5080156 6270528 | 18580 | -2.818 | -0.1247 | Yes | ||
| 41 | CXCR4 | 4590519 | 18594 | -3.106 | 0.0012 | Yes |

