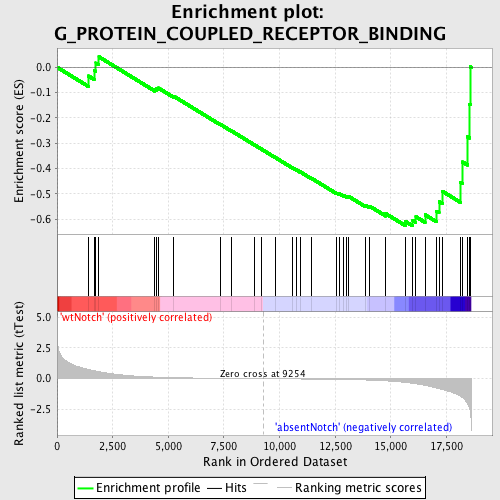
Profile of the Running ES Score & Positions of GeneSet Members on the Rank Ordered List
| Dataset | Set_03_absentNotch_versus_wtNotch.phenotype_absentNotch_versus_wtNotch.cls #wtNotch_versus_absentNotch |
| Phenotype | phenotype_absentNotch_versus_wtNotch.cls#wtNotch_versus_absentNotch |
| Upregulated in class | absentNotch |
| GeneSet | G_PROTEIN_COUPLED_RECEPTOR_BINDING |
| Enrichment Score (ES) | -0.6262269 |
| Normalized Enrichment Score (NES) | -1.5017008 |
| Nominal p-value | 0.02226345 |
| FDR q-value | 0.6801734 |
| FWER p-Value | 1.0 |
| PROBE | DESCRIPTION (from dataset) | GENE SYMBOL | GENE_TITLE | RANK IN GENE LIST | RANK METRIC SCORE | RUNNING ES | CORE ENRICHMENT | |
|---|---|---|---|---|---|---|---|---|
| 1 | CCL27 | 2120070 | 1409 | 0.751 | -0.0343 | No | ||
| 2 | CCL4 | 50368 430047 | 1666 | 0.642 | -0.0126 | No | ||
| 3 | CXCL1 | 2690537 | 1745 | 0.610 | 0.0170 | No | ||
| 4 | SLC9A3R1 | 6020373 | 1881 | 0.568 | 0.0412 | No | ||
| 5 | CCL22 | 6380086 | 4395 | 0.130 | -0.0869 | No | ||
| 6 | CORT | 360008 2340092 | 4478 | 0.124 | -0.0844 | No | ||
| 7 | CXCL12 | 580546 4150750 4570068 | 4549 | 0.120 | -0.0816 | No | ||
| 8 | GHRH | 4570575 | 5248 | 0.085 | -0.1145 | No | ||
| 9 | PROK2 | 540538 | 7352 | 0.028 | -0.2261 | No | ||
| 10 | CCL19 | 5080487 | 7856 | 0.020 | -0.2521 | No | ||
| 11 | CCL11 | 1770347 | 8856 | 0.005 | -0.3055 | No | ||
| 12 | CXCL10 | 2450408 | 9169 | 0.001 | -0.3223 | No | ||
| 13 | SAA1 | 5390520 | 9819 | -0.008 | -0.3568 | No | ||
| 14 | CCL1 | 4230167 | 10579 | -0.019 | -0.3966 | No | ||
| 15 | CCR2 | 1450519 | 10759 | -0.022 | -0.4050 | No | ||
| 16 | CXCL2 | 610398 | 10919 | -0.024 | -0.4123 | No | ||
| 17 | CXCL11 | 1090551 | 11449 | -0.033 | -0.4389 | No | ||
| 18 | CXCL5 | 6370333 | 12577 | -0.057 | -0.4964 | No | ||
| 19 | XCL1 | 3800504 | 12690 | -0.061 | -0.4991 | No | ||
| 20 | PSMC5 | 2760315 6550021 | 12865 | -0.066 | -0.5048 | No | ||
| 21 | GHRL | 2360619 6760438 | 13015 | -0.071 | -0.5089 | No | ||
| 22 | CALCA | 5860167 | 13102 | -0.073 | -0.5095 | No | ||
| 23 | CCL28 | 2690593 | 13842 | -0.104 | -0.5435 | No | ||
| 24 | CCL2 | 4760019 | 14048 | -0.116 | -0.5481 | No | ||
| 25 | CX3CL1 | 3990707 | 14773 | -0.171 | -0.5776 | No | ||
| 26 | CXCL13 | 6290402 | 15658 | -0.302 | -0.6085 | Yes | ||
| 27 | CCL25 | 450541 540435 | 15988 | -0.378 | -0.6053 | Yes | ||
| 28 | CCL24 | 670129 | 16129 | -0.413 | -0.5900 | Yes | ||
| 29 | CXCL14 | 840114 6450324 | 16540 | -0.542 | -0.5821 | Yes | ||
| 30 | CXCL9 | 1570673 | 17053 | -0.750 | -0.5682 | Yes | ||
| 31 | CCL3 | 2810092 | 17168 | -0.800 | -0.5301 | Yes | ||
| 32 | CCL8 | 3870010 | 17333 | -0.881 | -0.4902 | Yes | ||
| 33 | CCL7 | 2650519 | 18134 | -1.429 | -0.4543 | Yes | ||
| 34 | PF4 | 6130332 | 18220 | -1.542 | -0.3736 | Yes | ||
| 35 | CCL17 | 630121 | 18450 | -2.016 | -0.2744 | Yes | ||
| 36 | CXCL16 | 510278 | 18544 | -2.411 | -0.1461 | Yes | ||
| 37 | CCL5 | 3710397 | 18574 | -2.710 | 0.0023 | Yes |

