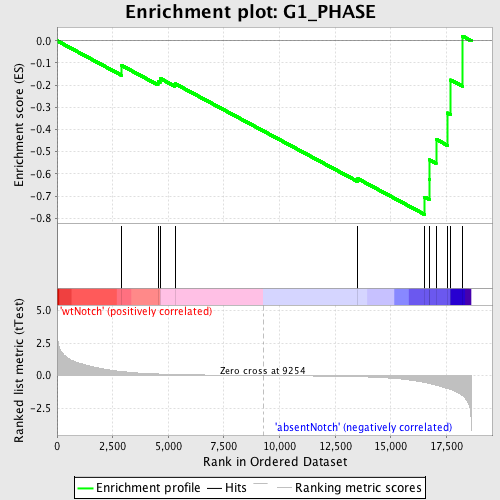
Profile of the Running ES Score & Positions of GeneSet Members on the Rank Ordered List
| Dataset | Set_03_absentNotch_versus_wtNotch.phenotype_absentNotch_versus_wtNotch.cls #wtNotch_versus_absentNotch |
| Phenotype | phenotype_absentNotch_versus_wtNotch.cls#wtNotch_versus_absentNotch |
| Upregulated in class | absentNotch |
| GeneSet | G1_PHASE |
| Enrichment Score (ES) | -0.7832408 |
| Normalized Enrichment Score (NES) | -1.5213069 |
| Nominal p-value | 0.024621213 |
| FDR q-value | 0.7265183 |
| FWER p-Value | 1.0 |
| PROBE | DESCRIPTION (from dataset) | GENE SYMBOL | GENE_TITLE | RANK IN GENE LIST | RANK METRIC SCORE | RUNNING ES | CORE ENRICHMENT | |
|---|---|---|---|---|---|---|---|---|
| 1 | GFI1B | 4570131 | 2897 | 0.306 | -0.1109 | No | ||
| 2 | CDC6 | 4570296 5360600 | 4536 | 0.120 | -0.1813 | No | ||
| 3 | MAP3K11 | 7000039 | 4629 | 0.115 | -0.1694 | No | ||
| 4 | CDC25C | 2570673 4760161 6520707 | 5298 | 0.082 | -0.1932 | No | ||
| 5 | CDC23 | 3190593 | 13518 | -0.089 | -0.6219 | No | ||
| 6 | RB1 | 5900338 | 16521 | -0.534 | -0.7049 | Yes | ||
| 7 | CDK6 | 4920253 | 16728 | -0.610 | -0.6265 | Yes | ||
| 8 | CDK10 | 60164 1190717 3130128 3990044 | 16749 | -0.618 | -0.5370 | Yes | ||
| 9 | TBRG4 | 3610239 6370594 | 17034 | -0.738 | -0.4441 | Yes | ||
| 10 | CDKN1C | 6520577 | 17550 | -0.999 | -0.3254 | Yes | ||
| 11 | CDK2 | 130484 2260301 4010088 5050110 | 17694 | -1.068 | -0.1766 | Yes | ||
| 12 | E2F1 | 5360093 | 18222 | -1.543 | 0.0212 | Yes |

