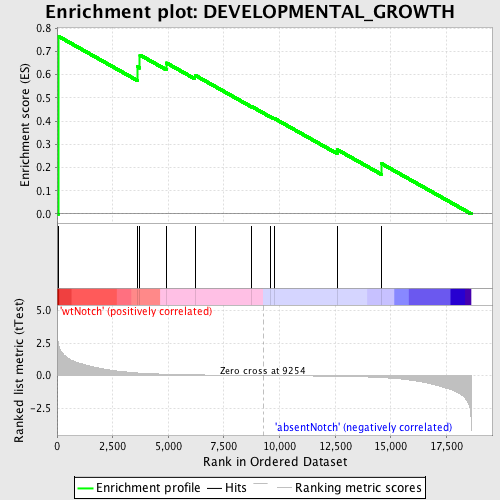
Profile of the Running ES Score & Positions of GeneSet Members on the Rank Ordered List
| Dataset | Set_03_absentNotch_versus_wtNotch.phenotype_absentNotch_versus_wtNotch.cls #wtNotch_versus_absentNotch |
| Phenotype | phenotype_absentNotch_versus_wtNotch.cls#wtNotch_versus_absentNotch |
| Upregulated in class | wtNotch |
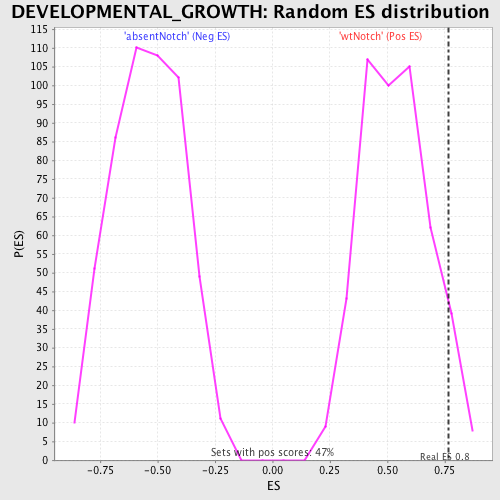
| GeneSet | DEVELOPMENTAL_GROWTH |
| Enrichment Score (ES) | 0.7660684 |
| Normalized Enrichment Score (NES) | 1.4327961 |
| Nominal p-value | 0.059196617 |
| FDR q-value | 1.0 |
| FWER p-Value | 1.0 |
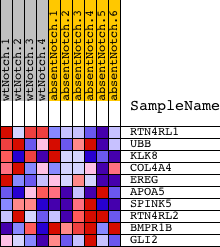
| PROBE | DESCRIPTION (from dataset) | GENE SYMBOL | GENE_TITLE | RANK IN GENE LIST | RANK METRIC SCORE | RUNNING ES | CORE ENRICHMENT | |
|---|---|---|---|---|---|---|---|---|
| 1 | RTN4RL1 | 2630368 | 44 | 2.549 | 0.7661 | Yes | ||
| 2 | UBB | 4810138 | 3601 | 0.199 | 0.6350 | No | ||
| 3 | KLK8 | 60035 2340440 | 3723 | 0.187 | 0.6847 | No | ||
| 4 | COL4A4 | 1050541 | 4919 | 0.099 | 0.6503 | No | ||
| 5 | EREG | 50519 4920129 | 6197 | 0.053 | 0.5976 | No | ||
| 6 | APOA5 | 6130471 | 8752 | 0.007 | 0.4624 | No | ||
| 7 | SPINK5 | 5900010 | 9579 | -0.004 | 0.4193 | No | ||
| 8 | RTN4RL2 | 6450609 | 9752 | -0.007 | 0.4121 | No | ||
| 9 | BMPR1B | 4560010 4760121 6450161 | 12589 | -0.058 | 0.2771 | No | ||
| 10 | GLI2 | 3060632 | 14583 | -0.155 | 0.2167 | No |