Profile of the Running ES Score & Positions of GeneSet Members on the Rank Ordered List
| Dataset | Set_03_absentNotch_versus_wtNotch.phenotype_absentNotch_versus_wtNotch.cls #wtNotch_versus_absentNotch |
| Phenotype | phenotype_absentNotch_versus_wtNotch.cls#wtNotch_versus_absentNotch |
| Upregulated in class | absentNotch |
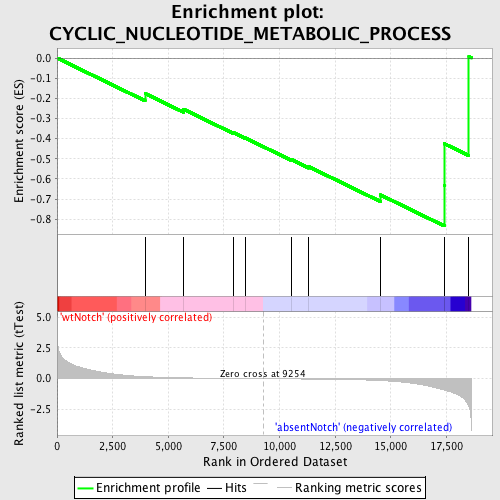
| GeneSet | CYCLIC_NUCLEOTIDE_METABOLIC_PROCESS |
| Enrichment Score (ES) | -0.8334783 |
| Normalized Enrichment Score (NES) | -1.5530311 |
| Nominal p-value | 0.017441861 |
| FDR q-value | 0.81619763 |
| FWER p-Value | 0.999 |
| PROBE | DESCRIPTION (from dataset) | GENE SYMBOL | GENE_TITLE | RANK IN GENE LIST | RANK METRIC SCORE | RUNNING ES | CORE ENRICHMENT | |
|---|---|---|---|---|---|---|---|---|
| 1 | ADORA2A | 1990687 | 3955 | 0.165 | -0.1763 | No | ||
| 2 | GRM8 | 4780082 | 5689 | 0.068 | -0.2546 | No | ||
| 3 | UCN2 | 4590372 | 7921 | 0.019 | -0.3703 | No | ||
| 4 | PTHLH | 5290739 | 8456 | 0.011 | -0.3966 | No | ||
| 5 | ABCA1 | 6290156 | 10521 | -0.018 | -0.5035 | No | ||
| 6 | PTH | 6650706 | 11312 | -0.031 | -0.5393 | No | ||
| 7 | ADCY7 | 6290520 7560739 | 14536 | -0.151 | -0.6795 | Yes | ||
| 8 | PDZD3 | 630711 | 17403 | -0.925 | -0.6305 | Yes | ||
| 9 | ADM | 4810121 | 17412 | -0.936 | -0.4256 | Yes | ||
| 10 | NUDT4 | 6760689 | 18510 | -2.234 | 0.0057 | Yes |

