Profile of the Running ES Score & Positions of GeneSet Members on the Rank Ordered List
| Dataset | Set_03_absentNotch_versus_wtNotch.phenotype_absentNotch_versus_wtNotch.cls #wtNotch_versus_absentNotch |
| Phenotype | phenotype_absentNotch_versus_wtNotch.cls#wtNotch_versus_absentNotch |
| Upregulated in class | wtNotch |
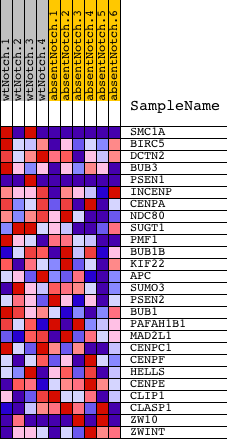
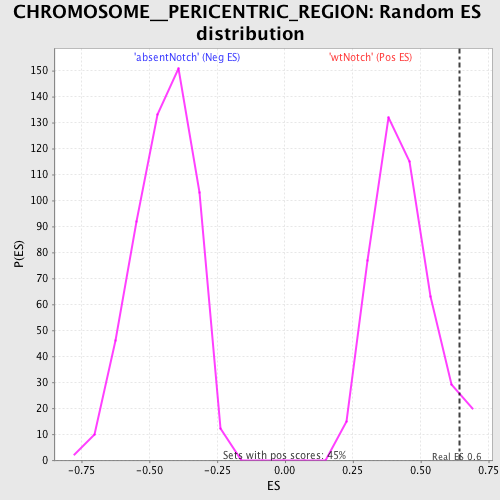
| GeneSet | CHROMOSOME__PERICENTRIC_REGION |
| Enrichment Score (ES) | 0.64463145 |
| Normalized Enrichment Score (NES) | 1.4950548 |
| Nominal p-value | 0.046563193 |
| FDR q-value | 1.0 |
| FWER p-Value | 1.0 |
| PROBE | DESCRIPTION (from dataset) | GENE SYMBOL | GENE_TITLE | RANK IN GENE LIST | RANK METRIC SCORE | RUNNING ES | CORE ENRICHMENT | |
|---|---|---|---|---|---|---|---|---|
| 1 | SMC1A | 3060600 5700148 5890113 6370154 | 260 | 1.678 | 0.1005 | Yes | ||
| 2 | BIRC5 | 110408 580014 1770632 | 321 | 1.558 | 0.2035 | Yes | ||
| 3 | DCTN2 | 540471 3780717 | 520 | 1.294 | 0.2812 | Yes | ||
| 4 | BUB3 | 3170546 | 535 | 1.277 | 0.3675 | Yes | ||
| 5 | PSEN1 | 130403 2030647 6100603 | 922 | 0.996 | 0.4147 | Yes | ||
| 6 | INCENP | 520593 | 982 | 0.963 | 0.4772 | Yes | ||
| 7 | CENPA | 5080154 | 1157 | 0.868 | 0.5271 | Yes | ||
| 8 | NDC80 | 4120465 | 1463 | 0.727 | 0.5603 | Yes | ||
| 9 | SUGT1 | 1690670 | 1716 | 0.622 | 0.5891 | Yes | ||
| 10 | PMF1 | 5130273 | 1933 | 0.555 | 0.6154 | Yes | ||
| 11 | BUB1B | 1450288 | 2189 | 0.474 | 0.6340 | Yes | ||
| 12 | KIF22 | 1190368 | 2817 | 0.321 | 0.6222 | Yes | ||
| 13 | APC | 3850484 5860722 | 3072 | 0.277 | 0.6274 | Yes | ||
| 14 | SUMO3 | 130600 3710136 | 3099 | 0.273 | 0.6446 | Yes | ||
| 15 | PSEN2 | 130382 | 3736 | 0.186 | 0.6231 | No | ||
| 16 | BUB1 | 5390270 | 4139 | 0.149 | 0.6116 | No | ||
| 17 | PAFAH1B1 | 4230333 6420121 6450066 | 4794 | 0.106 | 0.5836 | No | ||
| 18 | MAD2L1 | 4480725 | 5119 | 0.090 | 0.5723 | No | ||
| 19 | CENPC1 | 610273 | 5753 | 0.065 | 0.5427 | No | ||
| 20 | CENPF | 5050088 | 9318 | -0.001 | 0.3511 | No | ||
| 21 | HELLS | 4560086 4810025 | 9443 | -0.003 | 0.3446 | No | ||
| 22 | CENPE | 2850022 | 13172 | -0.076 | 0.1492 | No | ||
| 23 | CLIP1 | 2850162 6770397 | 14005 | -0.113 | 0.1122 | No | ||
| 24 | CLASP1 | 6860279 | 16409 | -0.498 | 0.0169 | No | ||
| 25 | ZW10 | 2900735 3520687 | 16852 | -0.658 | 0.0380 | No | ||
| 26 | ZWINT | 6940670 | 17231 | -0.833 | 0.0745 | No |