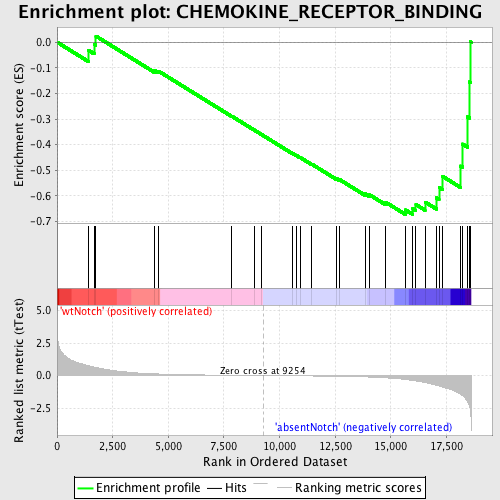
Profile of the Running ES Score & Positions of GeneSet Members on the Rank Ordered List
| Dataset | Set_03_absentNotch_versus_wtNotch.phenotype_absentNotch_versus_wtNotch.cls #wtNotch_versus_absentNotch |
| Phenotype | phenotype_absentNotch_versus_wtNotch.cls#wtNotch_versus_absentNotch |
| Upregulated in class | absentNotch |
| GeneSet | CHEMOKINE_RECEPTOR_BINDING |
| Enrichment Score (ES) | -0.6722718 |
| Normalized Enrichment Score (NES) | -1.5641757 |
| Nominal p-value | 0.015564202 |
| FDR q-value | 1.0 |
| FWER p-Value | 0.997 |
| PROBE | DESCRIPTION (from dataset) | GENE SYMBOL | GENE_TITLE | RANK IN GENE LIST | RANK METRIC SCORE | RUNNING ES | CORE ENRICHMENT | |
|---|---|---|---|---|---|---|---|---|
| 1 | CCL27 | 2120070 | 1409 | 0.751 | -0.0318 | No | ||
| 2 | CCL4 | 50368 430047 | 1666 | 0.642 | -0.0079 | No | ||
| 3 | CXCL1 | 2690537 | 1745 | 0.610 | 0.0237 | No | ||
| 4 | CCL22 | 6380086 | 4395 | 0.130 | -0.1112 | No | ||
| 5 | CXCL12 | 580546 4150750 4570068 | 4549 | 0.120 | -0.1124 | No | ||
| 6 | CCL19 | 5080487 | 7856 | 0.020 | -0.2891 | No | ||
| 7 | CCL11 | 1770347 | 8856 | 0.005 | -0.3425 | No | ||
| 8 | CXCL10 | 2450408 | 9169 | 0.001 | -0.3593 | No | ||
| 9 | CCL1 | 4230167 | 10579 | -0.019 | -0.4339 | No | ||
| 10 | CCR2 | 1450519 | 10759 | -0.022 | -0.4423 | No | ||
| 11 | CXCL2 | 610398 | 10919 | -0.024 | -0.4495 | No | ||
| 12 | CXCL11 | 1090551 | 11449 | -0.033 | -0.4760 | No | ||
| 13 | CXCL5 | 6370333 | 12577 | -0.057 | -0.5333 | No | ||
| 14 | XCL1 | 3800504 | 12690 | -0.061 | -0.5357 | No | ||
| 15 | CCL28 | 2690593 | 13842 | -0.104 | -0.5916 | No | ||
| 16 | CCL2 | 4760019 | 14048 | -0.116 | -0.5958 | No | ||
| 17 | CX3CL1 | 3990707 | 14773 | -0.171 | -0.6247 | No | ||
| 18 | CXCL13 | 6290402 | 15658 | -0.302 | -0.6546 | Yes | ||
| 19 | CCL25 | 450541 540435 | 15988 | -0.378 | -0.6501 | Yes | ||
| 20 | CCL24 | 670129 | 16129 | -0.413 | -0.6334 | Yes | ||
| 21 | CXCL14 | 840114 6450324 | 16540 | -0.542 | -0.6237 | Yes | ||
| 22 | CXCL9 | 1570673 | 17053 | -0.750 | -0.6073 | Yes | ||
| 23 | CCL3 | 2810092 | 17168 | -0.800 | -0.5666 | Yes | ||
| 24 | CCL8 | 3870010 | 17333 | -0.881 | -0.5238 | Yes | ||
| 25 | CCL7 | 2650519 | 18134 | -1.429 | -0.4830 | Yes | ||
| 26 | PF4 | 6130332 | 18220 | -1.542 | -0.3972 | Yes | ||
| 27 | CCL17 | 630121 | 18450 | -2.016 | -0.2914 | Yes | ||
| 28 | CXCL16 | 510278 | 18544 | -2.411 | -0.1550 | Yes | ||
| 29 | CCL5 | 3710397 | 18574 | -2.710 | 0.0023 | Yes |

