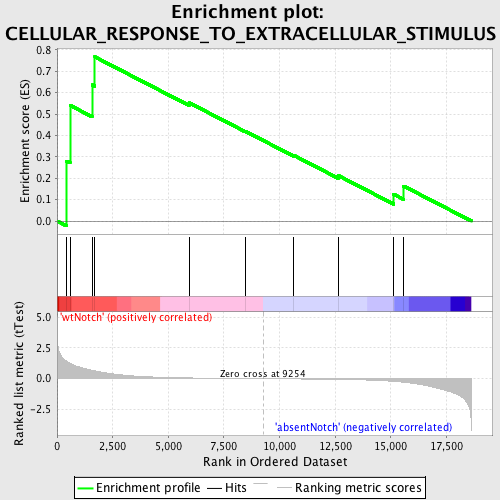
Profile of the Running ES Score & Positions of GeneSet Members on the Rank Ordered List
| Dataset | Set_03_absentNotch_versus_wtNotch.phenotype_absentNotch_versus_wtNotch.cls #wtNotch_versus_absentNotch |
| Phenotype | phenotype_absentNotch_versus_wtNotch.cls#wtNotch_versus_absentNotch |
| Upregulated in class | wtNotch |
| GeneSet | CELLULAR_RESPONSE_TO_EXTRACELLULAR_STIMULUS |
| Enrichment Score (ES) | 0.76761776 |
| Normalized Enrichment Score (NES) | 1.4255412 |
| Nominal p-value | 0.060606062 |
| FDR q-value | 1.0 |
| FWER p-Value | 1.0 |
| PROBE | DESCRIPTION (from dataset) | GENE SYMBOL | GENE_TITLE | RANK IN GENE LIST | RANK METRIC SCORE | RUNNING ES | CORE ENRICHMENT | |
|---|---|---|---|---|---|---|---|---|
| 1 | TP53 | 6130707 | 432 | 1.390 | 0.2806 | Yes | ||
| 2 | PPP1R9B | 3130619 | 585 | 1.227 | 0.5406 | Yes | ||
| 3 | CHMP1A | 5550441 | 1575 | 0.682 | 0.6364 | Yes | ||
| 4 | ASNS | 110368 7100687 | 1696 | 0.630 | 0.7676 | Yes | ||
| 5 | SREBF1 | 4780333 | 5934 | 0.060 | 0.5530 | No | ||
| 6 | CARTPT | 6660687 | 8455 | 0.011 | 0.4200 | No | ||
| 7 | PCSK9 | 3120044 | 10646 | -0.020 | 0.3066 | No | ||
| 8 | FADS1 | 5270537 | 12633 | -0.059 | 0.2128 | No | ||
| 9 | CDKN1A | 4050088 6400706 | 15127 | -0.212 | 0.1251 | No | ||
| 10 | CDKN2B | 6020040 | 15576 | -0.285 | 0.1634 | No |

