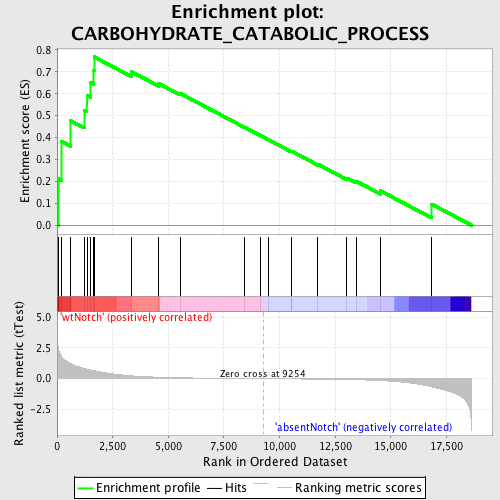
Profile of the Running ES Score & Positions of GeneSet Members on the Rank Ordered List
| Dataset | Set_03_absentNotch_versus_wtNotch.phenotype_absentNotch_versus_wtNotch.cls #wtNotch_versus_absentNotch |
| Phenotype | phenotype_absentNotch_versus_wtNotch.cls#wtNotch_versus_absentNotch |
| Upregulated in class | wtNotch |
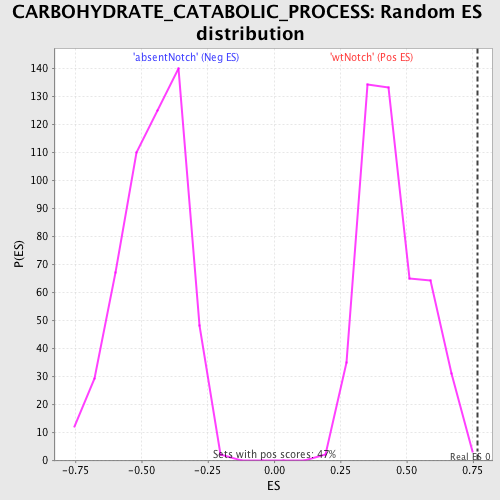
| GeneSet | CARBOHYDRATE_CATABOLIC_PROCESS |
| Enrichment Score (ES) | 0.76858604 |
| Normalized Enrichment Score (NES) | 1.7236018 |
| Nominal p-value | 0.0021413276 |
| FDR q-value | 0.45737168 |
| FWER p-Value | 0.403 |
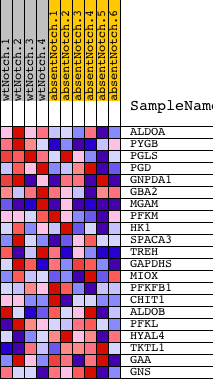
| PROBE | DESCRIPTION (from dataset) | GENE SYMBOL | GENE_TITLE | RANK IN GENE LIST | RANK METRIC SCORE | RUNNING ES | CORE ENRICHMENT | |
|---|---|---|---|---|---|---|---|---|
| 1 | ALDOA | 6290672 | 72 | 2.228 | 0.2113 | Yes | ||
| 2 | PYGB | 2510731 | 182 | 1.843 | 0.3835 | Yes | ||
| 3 | PGLS | 2120324 | 619 | 1.201 | 0.4760 | Yes | ||
| 4 | PGD | 6840048 | 1217 | 0.835 | 0.5246 | Yes | ||
| 5 | GNPDA1 | 580181 5220112 840731 | 1343 | 0.777 | 0.5930 | Yes | ||
| 6 | GBA2 | 2900372 | 1520 | 0.703 | 0.6514 | Yes | ||
| 7 | MGAM | 2510438 | 1651 | 0.648 | 0.7070 | Yes | ||
| 8 | PFKM | 1990156 5720168 | 1662 | 0.643 | 0.7686 | Yes | ||
| 9 | HK1 | 4280402 | 3345 | 0.232 | 0.7006 | No | ||
| 10 | SPACA3 | 1850161 | 4576 | 0.118 | 0.6459 | No | ||
| 11 | TREH | 630079 | 5527 | 0.073 | 0.6019 | No | ||
| 12 | GAPDHS | 2690463 | 8411 | 0.012 | 0.4480 | No | ||
| 13 | MIOX | 4810364 | 9141 | 0.002 | 0.4089 | No | ||
| 14 | PFKFB1 | 2370128 | 9496 | -0.004 | 0.3902 | No | ||
| 15 | CHIT1 | 7050347 | 10524 | -0.018 | 0.3367 | No | ||
| 16 | ALDOB | 4730324 | 10535 | -0.018 | 0.3380 | No | ||
| 17 | PFKL | 6200167 | 11724 | -0.038 | 0.2778 | No | ||
| 18 | HYAL4 | 1780020 | 13022 | -0.071 | 0.2148 | No | ||
| 19 | TKTL1 | 2810672 6760102 | 13436 | -0.086 | 0.2009 | No | ||
| 20 | GAA | 520035 | 14538 | -0.151 | 0.1563 | No | ||
| 21 | GNS | 3120458 | 16839 | -0.652 | 0.0956 | No |