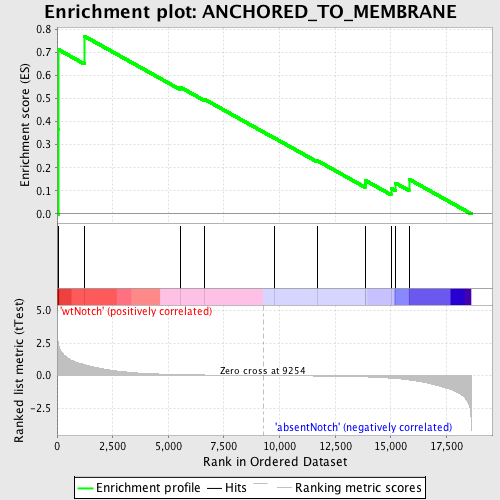
Profile of the Running ES Score & Positions of GeneSet Members on the Rank Ordered List
| Dataset | Set_03_absentNotch_versus_wtNotch.phenotype_absentNotch_versus_wtNotch.cls #wtNotch_versus_absentNotch |
| Phenotype | phenotype_absentNotch_versus_wtNotch.cls#wtNotch_versus_absentNotch |
| Upregulated in class | wtNotch |
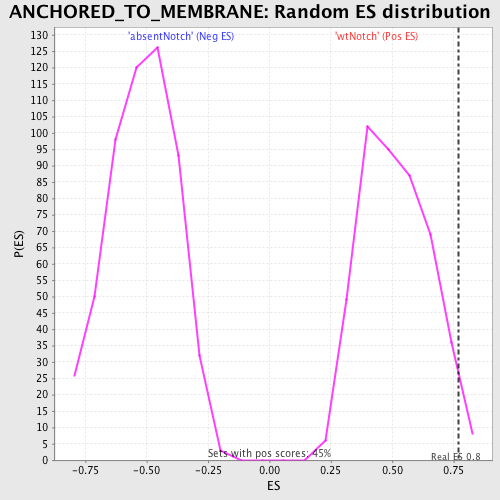
| GeneSet | ANCHORED_TO_MEMBRANE |
| Enrichment Score (ES) | 0.77014333 |
| Normalized Enrichment Score (NES) | 1.5053017 |
| Nominal p-value | 0.019911505 |
| FDR q-value | 1.0 |
| FWER p-Value | 1.0 |
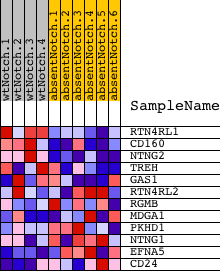
| PROBE | DESCRIPTION (from dataset) | GENE SYMBOL | GENE_TITLE | RANK IN GENE LIST | RANK METRIC SCORE | RUNNING ES | CORE ENRICHMENT | |
|---|---|---|---|---|---|---|---|---|
| 1 | RTN4RL1 | 2630368 | 44 | 2.549 | 0.3673 | Yes | ||
| 2 | CD160 | 4210377 | 56 | 2.382 | 0.7121 | Yes | ||
| 3 | NTNG2 | 1770438 6380408 | 1223 | 0.833 | 0.7701 | Yes | ||
| 4 | TREH | 630079 | 5527 | 0.073 | 0.5495 | No | ||
| 5 | GAS1 | 2120504 | 6637 | 0.042 | 0.4961 | No | ||
| 6 | RTN4RL2 | 6450609 | 9752 | -0.007 | 0.3297 | No | ||
| 7 | RGMB | 670504 4570450 | 11682 | -0.037 | 0.2314 | No | ||
| 8 | MDGA1 | 1170139 | 13843 | -0.104 | 0.1304 | No | ||
| 9 | PKHD1 | 70403 4810402 | 13878 | -0.105 | 0.1438 | No | ||
| 10 | NTNG1 | 50270 1410427 4810333 | 15012 | -0.199 | 0.1118 | No | ||
| 11 | EFNA5 | 460707 2190519 | 15207 | -0.225 | 0.1340 | No | ||
| 12 | CD24 | 1780091 | 15819 | -0.339 | 0.1503 | No |