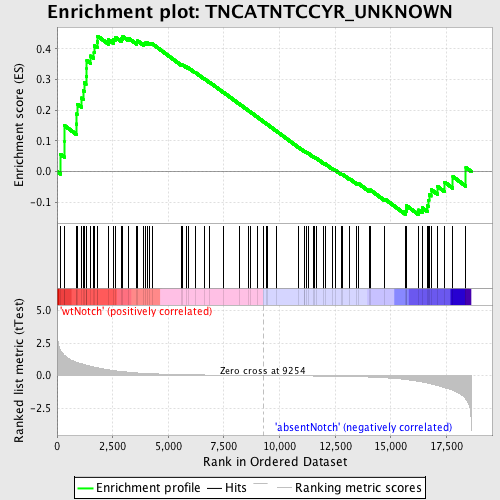
Profile of the Running ES Score & Positions of GeneSet Members on the Rank Ordered List
| Dataset | Set_03_absentNotch_versus_wtNotch.phenotype_absentNotch_versus_wtNotch.cls #wtNotch_versus_absentNotch |
| Phenotype | phenotype_absentNotch_versus_wtNotch.cls#wtNotch_versus_absentNotch |
| Upregulated in class | wtNotch |
| GeneSet | TNCATNTCCYR_UNKNOWN |
| Enrichment Score (ES) | 0.44121784 |
| Normalized Enrichment Score (NES) | 1.2362225 |
| Nominal p-value | 0.0945946 |
| FDR q-value | 1.0 |
| FWER p-Value | 1.0 |
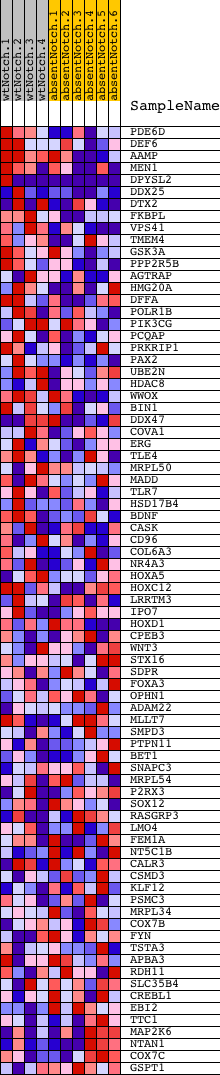
| PROBE | DESCRIPTION (from dataset) | GENE SYMBOL | GENE_TITLE | RANK IN GENE LIST | RANK METRIC SCORE | RUNNING ES | CORE ENRICHMENT | |
|---|---|---|---|---|---|---|---|---|
| 1 | PDE6D | 3130537 3390014 | 151 | 1.939 | 0.0563 | Yes | ||
| 2 | DEF6 | 840593 | 324 | 1.555 | 0.0987 | Yes | ||
| 3 | AAMP | 2640059 | 329 | 1.551 | 0.1500 | Yes | ||
| 4 | MEN1 | 4850300 5900671 | 864 | 1.020 | 0.1552 | Yes | ||
| 5 | DPYSL2 | 2100427 3130112 5700324 | 880 | 1.007 | 0.1878 | Yes | ||
| 6 | DDX25 | 5910121 | 899 | 1.001 | 0.2201 | Yes | ||
| 7 | DTX2 | 4210041 7000008 | 1091 | 0.904 | 0.2399 | Yes | ||
| 8 | FKBPL | 6550592 | 1175 | 0.860 | 0.2640 | Yes | ||
| 9 | VPS41 | 770056 4730471 | 1221 | 0.833 | 0.2892 | Yes | ||
| 10 | TMEM4 | 6220091 | 1301 | 0.793 | 0.3113 | Yes | ||
| 11 | GSK3A | 3140735 | 1334 | 0.779 | 0.3355 | Yes | ||
| 12 | PPP2R5B | 2900441 | 1339 | 0.778 | 0.3611 | Yes | ||
| 13 | AGTRAP | 6130180 | 1495 | 0.717 | 0.3766 | Yes | ||
| 14 | HMG20A | 4590113 | 1657 | 0.646 | 0.3894 | Yes | ||
| 15 | DFFA | 2850215 | 1678 | 0.639 | 0.4095 | Yes | ||
| 16 | POLR1B | 510315 | 1803 | 0.596 | 0.4227 | Yes | ||
| 17 | PIK3CG | 5890110 | 1823 | 0.589 | 0.4412 | Yes | ||
| 18 | PCQAP | 3060064 6200273 | 2310 | 0.439 | 0.4296 | No | ||
| 19 | PRKRIP1 | 4280746 6100390 | 2525 | 0.381 | 0.4307 | No | ||
| 20 | PAX2 | 6040270 7000133 | 2610 | 0.363 | 0.4382 | No | ||
| 21 | UBE2N | 520369 2900047 | 2888 | 0.307 | 0.4335 | No | ||
| 22 | HDAC8 | 3440504 | 2953 | 0.296 | 0.4399 | No | ||
| 23 | WWOX | 510008 870524 1090114 | 3215 | 0.251 | 0.4342 | No | ||
| 24 | BIN1 | 5420348 5670500 | 3583 | 0.201 | 0.4211 | No | ||
| 25 | DDX47 | 1340133 3870152 6620647 | 3620 | 0.197 | 0.4257 | No | ||
| 26 | COVA1 | 5340504 5360594 | 3903 | 0.169 | 0.4161 | No | ||
| 27 | ERG | 50154 1770739 | 3951 | 0.166 | 0.4191 | No | ||
| 28 | TLE4 | 1450064 1500519 | 4045 | 0.158 | 0.4193 | No | ||
| 29 | MRPL50 | 1740465 | 4162 | 0.147 | 0.4179 | No | ||
| 30 | MADD | 6100725 7000088 | 4266 | 0.139 | 0.4170 | No | ||
| 31 | TLR7 | 3140300 | 5574 | 0.072 | 0.3488 | No | ||
| 32 | HSD17B4 | 4780504 | 5643 | 0.069 | 0.3475 | No | ||
| 33 | BDNF | 2940128 3520368 | 5794 | 0.064 | 0.3415 | No | ||
| 34 | CASK | 2340215 3290576 6770215 | 5887 | 0.061 | 0.3386 | No | ||
| 35 | CD96 | 2320048 | 6206 | 0.053 | 0.3232 | No | ||
| 36 | COL6A3 | 2640717 4070064 5390717 | 6627 | 0.043 | 0.3019 | No | ||
| 37 | NR4A3 | 2900021 5860095 5910039 | 6865 | 0.038 | 0.2904 | No | ||
| 38 | HOXA5 | 6840026 | 7482 | 0.026 | 0.2580 | No | ||
| 39 | HOXC12 | 5270411 | 8179 | 0.015 | 0.2210 | No | ||
| 40 | LRRTM3 | 4210021 | 8593 | 0.009 | 0.1990 | No | ||
| 41 | IPO7 | 2190746 | 8681 | 0.008 | 0.1946 | No | ||
| 42 | HOXD1 | 7000458 | 9023 | 0.003 | 0.1763 | No | ||
| 43 | CPEB3 | 3940164 | 9297 | -0.000 | 0.1616 | No | ||
| 44 | WNT3 | 2360685 | 9398 | -0.002 | 0.1563 | No | ||
| 45 | STX16 | 70315 | 9475 | -0.003 | 0.1523 | No | ||
| 46 | SDPR | 3360292 | 9867 | -0.008 | 0.1315 | No | ||
| 47 | FOXA3 | 2680121 | 10842 | -0.023 | 0.0797 | No | ||
| 48 | OPHN1 | 2360100 | 11101 | -0.027 | 0.0667 | No | ||
| 49 | ADAM22 | 5390368 | 11128 | -0.028 | 0.0662 | No | ||
| 50 | MLLT7 | 4480707 | 11189 | -0.029 | 0.0639 | No | ||
| 51 | SMPD3 | 520164 | 11306 | -0.030 | 0.0586 | No | ||
| 52 | PTPN11 | 2230100 2470180 6100528 | 11527 | -0.034 | 0.0479 | No | ||
| 53 | BET1 | 4010725 | 11566 | -0.035 | 0.0470 | No | ||
| 54 | SNAPC3 | 2360563 6200408 6650167 | 11643 | -0.037 | 0.0441 | No | ||
| 55 | MRPL54 | 870403 | 11983 | -0.043 | 0.0273 | No | ||
| 56 | P2RX3 | 4230397 | 12042 | -0.044 | 0.0256 | No | ||
| 57 | SOX12 | 1780037 | 12391 | -0.053 | 0.0086 | No | ||
| 58 | RASGRP3 | 6020504 | 12495 | -0.055 | 0.0049 | No | ||
| 59 | LMO4 | 3800746 | 12781 | -0.064 | -0.0084 | No | ||
| 60 | FEM1A | 6520091 | 12827 | -0.065 | -0.0086 | No | ||
| 61 | NT5C1B | 380050 | 13155 | -0.075 | -0.0238 | No | ||
| 62 | CALR3 | 60601 3840088 5570592 6020139 | 13470 | -0.087 | -0.0378 | No | ||
| 63 | CSMD3 | 1660427 1940687 | 13555 | -0.091 | -0.0393 | No | ||
| 64 | KLF12 | 1660095 4810288 5340546 6520286 | 14054 | -0.117 | -0.0623 | No | ||
| 65 | PSMC3 | 2480184 | 14076 | -0.118 | -0.0595 | No | ||
| 66 | MRPL34 | 3520605 | 14732 | -0.168 | -0.0893 | No | ||
| 67 | COX7B | 2340504 | 15659 | -0.302 | -0.1292 | No | ||
| 68 | FYN | 2100468 4760520 4850687 | 15696 | -0.311 | -0.1208 | No | ||
| 69 | TSTA3 | 1230100 | 15707 | -0.312 | -0.1110 | No | ||
| 70 | APBA3 | 2510348 | 16238 | -0.442 | -0.1249 | No | ||
| 71 | RDH11 | 4810673 | 16410 | -0.498 | -0.1175 | No | ||
| 72 | SLC35B4 | 6550170 | 16656 | -0.580 | -0.1115 | No | ||
| 73 | CREBL1 | 1340546 | 16699 | -0.600 | -0.0938 | No | ||
| 74 | EBI2 | 6220722 | 16716 | -0.607 | -0.0745 | No | ||
| 75 | TTC1 | 5890736 | 16808 | -0.639 | -0.0582 | No | ||
| 76 | MAP2K6 | 1230056 2940204 | 17105 | -0.770 | -0.0486 | No | ||
| 77 | NTAN1 | 3440593 | 17422 | -0.940 | -0.0343 | No | ||
| 78 | COX7C | 2470047 | 17790 | -1.143 | -0.0162 | No | ||
| 79 | GSPT1 | 5420050 | 18376 | -1.825 | 0.0129 | No |