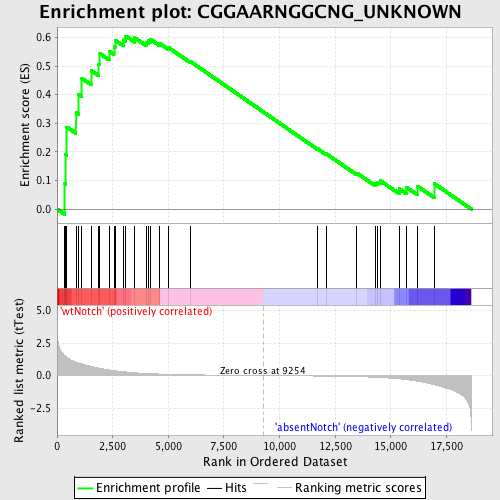
Profile of the Running ES Score & Positions of GeneSet Members on the Rank Ordered List
| Dataset | Set_03_absentNotch_versus_wtNotch.phenotype_absentNotch_versus_wtNotch.cls #wtNotch_versus_absentNotch |
| Phenotype | phenotype_absentNotch_versus_wtNotch.cls#wtNotch_versus_absentNotch |
| Upregulated in class | wtNotch |
| GeneSet | CGGAARNGGCNG_UNKNOWN |
| Enrichment Score (ES) | 0.6048573 |
| Normalized Enrichment Score (NES) | 1.4750452 |
| Nominal p-value | 0.03267974 |
| FDR q-value | 1.0 |
| FWER p-Value | 0.922 |
| PROBE | DESCRIPTION (from dataset) | GENE SYMBOL | GENE_TITLE | RANK IN GENE LIST | RANK METRIC SCORE | RUNNING ES | CORE ENRICHMENT | |
|---|---|---|---|---|---|---|---|---|
| 1 | RAB4B | 1770204 | 349 | 1.516 | 0.0892 | Yes | ||
| 2 | CDC37 | 2570537 | 393 | 1.451 | 0.1902 | Yes | ||
| 3 | TP53 | 6130707 | 432 | 1.390 | 0.2871 | Yes | ||
| 4 | CFL1 | 2340735 | 849 | 1.027 | 0.3378 | Yes | ||
| 5 | LMAN2 | 430154 | 963 | 0.976 | 0.4012 | Yes | ||
| 6 | TPT1 | 3450035 | 1102 | 0.898 | 0.4578 | Yes | ||
| 7 | BIN3 | 380551 | 1526 | 0.700 | 0.4848 | Yes | ||
| 8 | RHOBTB2 | 1570129 2320253 3520253 | 1871 | 0.571 | 0.5070 | Yes | ||
| 9 | EGR1 | 4610347 | 1925 | 0.558 | 0.5439 | Yes | ||
| 10 | RGL2 | 1740017 | 2338 | 0.431 | 0.5524 | Yes | ||
| 11 | POLH | 2690528 | 2558 | 0.373 | 0.5672 | Yes | ||
| 12 | PAX2 | 6040270 7000133 | 2610 | 0.363 | 0.5903 | Yes | ||
| 13 | PANK2 | 130446 | 2978 | 0.291 | 0.5913 | Yes | ||
| 14 | GTF2A1 | 4120138 4920524 5390110 1230397 | 3090 | 0.274 | 0.6049 | Yes | ||
| 15 | ATP2A2 | 1090075 3990279 | 3485 | 0.214 | 0.5989 | No | ||
| 16 | RNF14 | 50402 1340041 6370687 | 4004 | 0.161 | 0.5825 | No | ||
| 17 | VPS39 | 50332 | 4098 | 0.152 | 0.5883 | No | ||
| 18 | XPO5 | 2850286 | 4184 | 0.145 | 0.5941 | No | ||
| 19 | SLC36A1 | 5080242 | 4620 | 0.116 | 0.5789 | No | ||
| 20 | CHCHD5 | 3830575 | 5028 | 0.094 | 0.5637 | No | ||
| 21 | EML2 | 4060411 | 5982 | 0.058 | 0.5165 | No | ||
| 22 | RAD17 | 5220739 | 11713 | -0.038 | 0.2110 | No | ||
| 23 | UMPS | 2340541 4730438 | 12104 | -0.046 | 0.1932 | No | ||
| 24 | GANAB | 1980400 5720717 | 13466 | -0.087 | 0.1262 | No | ||
| 25 | TAF9 | 1850458 3830136 | 14306 | -0.133 | 0.0906 | No | ||
| 26 | SPTLC2 | 6840324 520017 | 14420 | -0.141 | 0.0945 | No | ||
| 27 | HTATIP | 5360739 | 14522 | -0.149 | 0.0997 | No | ||
| 28 | IRAK1 | 4120593 | 15392 | -0.251 | 0.0708 | No | ||
| 29 | CLTC | 6590458 | 15692 | -0.309 | 0.0767 | No | ||
| 30 | DUSP6 | 5910286 7100070 | 16198 | -0.432 | 0.0803 | No | ||
| 31 | HNRPH1 | 1170086 3140546 3290471 6110184 6110373 | 16951 | -0.698 | 0.0896 | No |

