Profile of the Running ES Score & Positions of GeneSet Members on the Rank Ordered List
| Dataset | Set_03_absentNotch_versus_wtNotch.phenotype_absentNotch_versus_wtNotch.cls #wtNotch_versus_absentNotch |
| Phenotype | phenotype_absentNotch_versus_wtNotch.cls#wtNotch_versus_absentNotch |
| Upregulated in class | absentNotch |
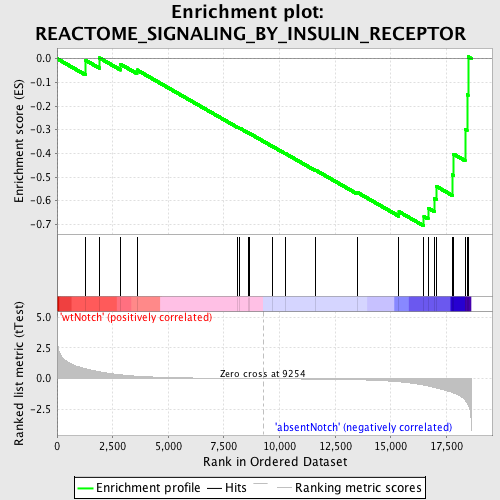
| GeneSet | REACTOME_SIGNALING_BY_INSULIN_RECEPTOR |
| Enrichment Score (ES) | -0.70673895 |
| Normalized Enrichment Score (NES) | -1.53608 |
| Nominal p-value | 0.024952015 |
| FDR q-value | 0.56560624 |
| FWER p-Value | 1.0 |
| PROBE | DESCRIPTION (from dataset) | GENE SYMBOL | GENE_TITLE | RANK IN GENE LIST | RANK METRIC SCORE | RUNNING ES | CORE ENRICHMENT | |
|---|---|---|---|---|---|---|---|---|
| 1 | MAPK3 | 580161 4780035 | 1279 | 0.803 | -0.0067 | No | ||
| 2 | PDE3B | 2030563 | 1905 | 0.562 | 0.0032 | No | ||
| 3 | EEF2K | 3800673 | 2856 | 0.313 | -0.0237 | No | ||
| 4 | SOS1 | 7050338 | 3591 | 0.201 | -0.0477 | No | ||
| 5 | RHEB | 6760441 | 8127 | 0.016 | -0.2903 | No | ||
| 6 | AKT2 | 3850541 3870519 | 8207 | 0.015 | -0.2934 | No | ||
| 7 | EIF4G1 | 4070446 | 8585 | 0.009 | -0.3129 | No | ||
| 8 | PIK3R1 | 4730671 | 8630 | 0.008 | -0.3147 | No | ||
| 9 | MAP2K1 | 840739 | 9684 | -0.006 | -0.3709 | No | ||
| 10 | EIF4EBP1 | 60132 5720148 | 10261 | -0.014 | -0.4007 | No | ||
| 11 | SHC1 | 2900731 3170504 6520537 | 11609 | -0.036 | -0.4704 | No | ||
| 12 | RPS6KB1 | 1450427 5080110 6200563 | 13483 | -0.088 | -0.5643 | No | ||
| 13 | INSR | 1190504 | 15366 | -0.247 | -0.6465 | No | ||
| 14 | MAPK1 | 3190193 6200253 | 16488 | -0.522 | -0.6664 | Yes | ||
| 15 | EIF4E | 1580403 70133 6380215 | 16676 | -0.587 | -0.6310 | Yes | ||
| 16 | KRAS | 2060170 | 16950 | -0.698 | -0.5917 | Yes | ||
| 17 | MAP2K2 | 4590601 | 17045 | -0.745 | -0.5392 | Yes | ||
| 18 | PIK3CB | 3800600 | 17779 | -1.134 | -0.4909 | Yes | ||
| 19 | PDPK1 | 6650168 | 17818 | -1.163 | -0.4030 | Yes | ||
| 20 | YWHAB | 1740176 | 18339 | -1.729 | -0.2973 | Yes | ||
| 21 | RAF1 | 1770600 | 18428 | -1.946 | -0.1516 | Yes | ||
| 22 | EIF4B | 5390563 5270577 | 18473 | -2.090 | 0.0077 | Yes |

