Profile of the Running ES Score & Positions of GeneSet Members on the Rank Ordered List
| Dataset | Set_03_absentNotch_versus_wtNotch.phenotype_absentNotch_versus_wtNotch.cls #wtNotch_versus_absentNotch |
| Phenotype | phenotype_absentNotch_versus_wtNotch.cls#wtNotch_versus_absentNotch |
| Upregulated in class | wtNotch |
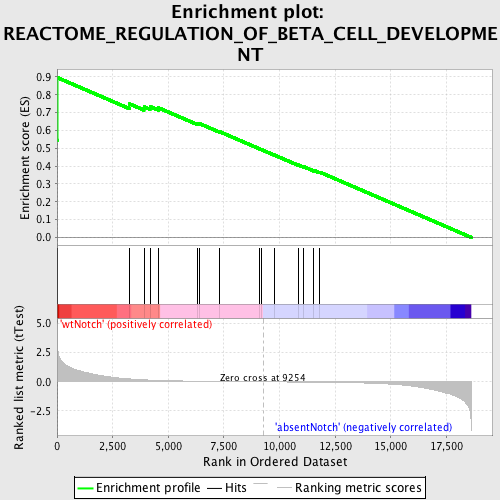
| GeneSet | REACTOME_REGULATION_OF_BETA_CELL_DEVELOPMENT |
| Enrichment Score (ES) | 0.89619774 |
| Normalized Enrichment Score (NES) | 1.8791059 |
| Nominal p-value | 0.0 |
| FDR q-value | 0.0075114015 |
| FWER p-Value | 0.012 |
| PROBE | DESCRIPTION (from dataset) | GENE SYMBOL | GENE_TITLE | RANK IN GENE LIST | RANK METRIC SCORE | RUNNING ES | CORE ENRICHMENT | |
|---|---|---|---|---|---|---|---|---|
| 1 | NOTCH1 | 3390114 | 0 | 4.962 | 0.5464 | Yes | ||
| 2 | HES1 | 4810280 | 10 | 3.181 | 0.8962 | Yes | ||
| 3 | SLC2A2 | 5130537 5720722 6770079 | 3258 | 0.245 | 0.7486 | No | ||
| 4 | PTF1A | 6450377 | 3906 | 0.169 | 0.7325 | No | ||
| 5 | NEUROD1 | 3060619 | 4179 | 0.145 | 0.7338 | No | ||
| 6 | IAPP | 4230040 | 4558 | 0.119 | 0.7266 | No | ||
| 7 | PAX4 | 6620619 | 6308 | 0.050 | 0.6381 | No | ||
| 8 | INSM1 | 3450671 | 6420 | 0.047 | 0.6373 | No | ||
| 9 | NKX6-1 | 6040731 | 7303 | 0.029 | 0.5931 | No | ||
| 10 | AKT1 | 5290746 | 9115 | 0.002 | 0.4959 | No | ||
| 11 | FGF10 | 730458 840706 | 9201 | 0.001 | 0.4915 | No | ||
| 12 | HNF4G | 5720451 | 9753 | -0.007 | 0.4626 | No | ||
| 13 | FOXA3 | 2680121 | 10842 | -0.023 | 0.4066 | No | ||
| 14 | NKX2-2 | 4150731 | 11094 | -0.027 | 0.3961 | No | ||
| 15 | ONECUT3 | 5720487 6100037 | 11543 | -0.035 | 0.3758 | No | ||
| 16 | PDX1 | 6660647 | 11810 | -0.040 | 0.3659 | No |

