Profile of the Running ES Score & Positions of GeneSet Members on the Rank Ordered List
| Dataset | Set_03_absentNotch_versus_wtNotch.phenotype_absentNotch_versus_wtNotch.cls #wtNotch_versus_absentNotch |
| Phenotype | phenotype_absentNotch_versus_wtNotch.cls#wtNotch_versus_absentNotch |
| Upregulated in class | absentNotch |
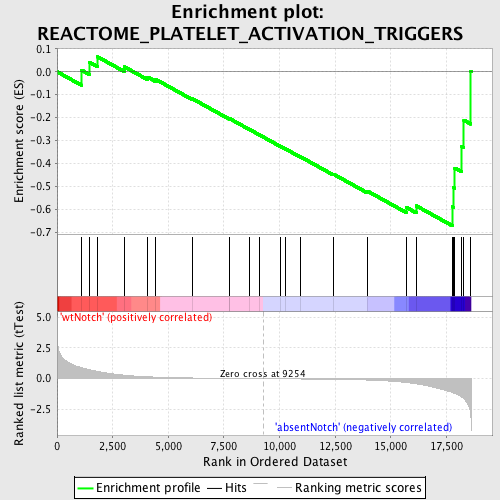
| GeneSet | REACTOME_PLATELET_ACTIVATION_TRIGGERS |
| Enrichment Score (ES) | -0.67302895 |
| Normalized Enrichment Score (NES) | -1.4876848 |
| Nominal p-value | 0.039252337 |
| FDR q-value | 0.68833864 |
| FWER p-Value | 1.0 |
| PROBE | DESCRIPTION (from dataset) | GENE SYMBOL | GENE_TITLE | RANK IN GENE LIST | RANK METRIC SCORE | RUNNING ES | CORE ENRICHMENT | |
|---|---|---|---|---|---|---|---|---|
| 1 | PLCG2 | 5720008 | 1101 | 0.899 | 0.0069 | No | ||
| 2 | VAV1 | 6020487 | 1466 | 0.727 | 0.0408 | No | ||
| 3 | PIK3CG | 5890110 | 1823 | 0.589 | 0.0650 | No | ||
| 4 | TBXA2R | 2370292 3940066 | 3016 | 0.286 | 0.0220 | No | ||
| 5 | F2R | 4810180 | 4071 | 0.155 | -0.0233 | No | ||
| 6 | F2 | 5720280 | 4430 | 0.127 | -0.0332 | No | ||
| 7 | LYN | 6040600 | 6066 | 0.056 | -0.1170 | No | ||
| 8 | LCP2 | 2680066 6650707 | 7738 | 0.022 | -0.2052 | No | ||
| 9 | PLA2G4A | 6380364 | 7770 | 0.021 | -0.2053 | No | ||
| 10 | PIK3R1 | 4730671 | 8630 | 0.008 | -0.2509 | No | ||
| 11 | AKT1 | 5290746 | 9115 | 0.002 | -0.2768 | No | ||
| 12 | FCER1G | 5550020 | 10022 | -0.011 | -0.3247 | No | ||
| 13 | F2RL2 | 6110736 | 10266 | -0.014 | -0.3367 | No | ||
| 14 | P2RY1 | 6040121 | 10954 | -0.025 | -0.3719 | No | ||
| 15 | SYK | 6940133 | 12413 | -0.053 | -0.4463 | No | ||
| 16 | GNAQ | 430670 4210131 5900736 | 13945 | -0.110 | -0.5206 | No | ||
| 17 | FYN | 2100468 4760520 4850687 | 15696 | -0.311 | -0.5919 | Yes | ||
| 18 | MAPK14 | 5290731 | 16148 | -0.418 | -0.5854 | Yes | ||
| 19 | PIK3CB | 3800600 | 17779 | -1.134 | -0.5896 | Yes | ||
| 20 | PDPK1 | 6650168 | 17818 | -1.163 | -0.5060 | Yes | ||
| 21 | GNA13 | 4590102 | 17876 | -1.205 | -0.4204 | Yes | ||
| 22 | GNB1 | 2120397 | 18190 | -1.508 | -0.3263 | Yes | ||
| 23 | GNG2 | 2230390 | 18284 | -1.627 | -0.2116 | Yes | ||
| 24 | PRKCZ | 3780279 | 18595 | -3.117 | 0.0011 | Yes |

