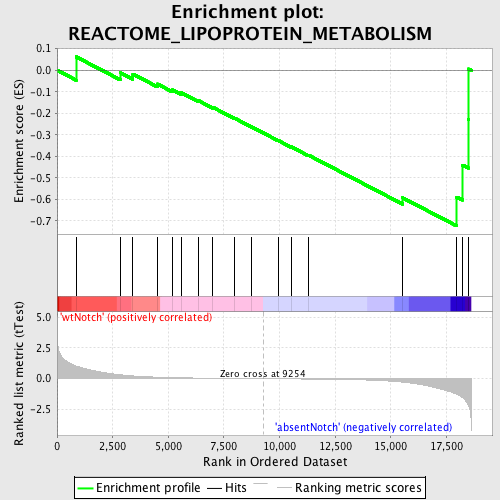
Profile of the Running ES Score & Positions of GeneSet Members on the Rank Ordered List
| Dataset | Set_03_absentNotch_versus_wtNotch.phenotype_absentNotch_versus_wtNotch.cls #wtNotch_versus_absentNotch |
| Phenotype | phenotype_absentNotch_versus_wtNotch.cls#wtNotch_versus_absentNotch |
| Upregulated in class | absentNotch |
| GeneSet | REACTOME_LIPOPROTEIN_METABOLISM |
| Enrichment Score (ES) | -0.7232972 |
| Normalized Enrichment Score (NES) | -1.5445998 |
| Nominal p-value | 0.02661597 |
| FDR q-value | 0.7121984 |
| FWER p-Value | 0.999 |

| PROBE | DESCRIPTION (from dataset) | GENE SYMBOL | GENE_TITLE | RANK IN GENE LIST | RANK METRIC SCORE | RUNNING ES | CORE ENRICHMENT | |
|---|---|---|---|---|---|---|---|---|
| 1 | LPL | 1450735 2970706 | 856 | 1.023 | 0.0622 | No | ||
| 2 | APOC2 | 50100 | 2845 | 0.315 | -0.0115 | No | ||
| 3 | LDLR | 5670386 | 3405 | 0.224 | -0.0179 | No | ||
| 4 | APOB | 2370672 | 4502 | 0.123 | -0.0638 | No | ||
| 5 | LIPC | 2690497 | 5187 | 0.087 | -0.0914 | No | ||
| 6 | APOA4 | 4120451 | 5583 | 0.072 | -0.1051 | No | ||
| 7 | A2M | 6620039 | 6360 | 0.049 | -0.1417 | No | ||
| 8 | APOC3 | 2030168 | 6999 | 0.035 | -0.1722 | No | ||
| 9 | APOA2 | 6510364 6860411 | 7968 | 0.018 | -0.2223 | No | ||
| 10 | APOA5 | 6130471 | 8752 | 0.007 | -0.2637 | No | ||
| 11 | CUBN | 630338 | 9939 | -0.010 | -0.3265 | No | ||
| 12 | ABCA1 | 6290156 | 10521 | -0.018 | -0.3558 | No | ||
| 13 | LCAT | 6400441 | 11287 | -0.030 | -0.3938 | No | ||
| 14 | APOA1 | 110152 | 15531 | -0.278 | -0.5925 | Yes | ||
| 15 | MTTP | 3780161 | 17964 | -1.266 | -0.5894 | Yes | ||
| 16 | P4HB | 6110056 | 18215 | -1.537 | -0.4403 | Yes | ||
| 17 | HSPG2 | 2510687 6220750 | 18480 | -2.137 | -0.2285 | Yes | ||
| 18 | APOE | 4200671 | 18507 | -2.229 | 0.0059 | Yes |

