Profile of the Running ES Score & Positions of GeneSet Members on the Rank Ordered List
| Dataset | Set_03_absentNotch_versus_wtNotch.phenotype_absentNotch_versus_wtNotch.cls #wtNotch_versus_absentNotch |
| Phenotype | phenotype_absentNotch_versus_wtNotch.cls#wtNotch_versus_absentNotch |
| Upregulated in class | wtNotch |
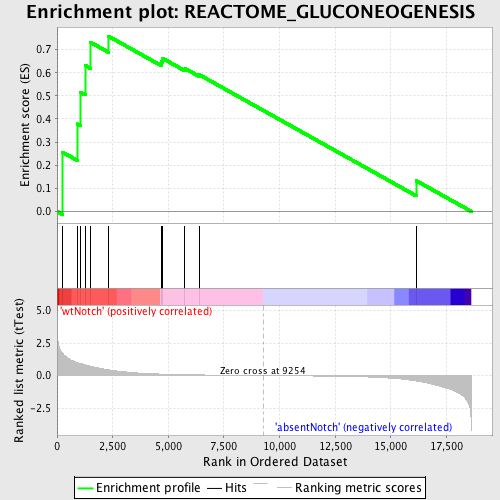
| GeneSet | REACTOME_GLUCONEOGENESIS |
| Enrichment Score (ES) | 0.75839657 |
| Normalized Enrichment Score (NES) | 1.4562712 |
| Nominal p-value | 0.046511628 |
| FDR q-value | 0.6023536 |
| FWER p-Value | 1.0 |
| PROBE | DESCRIPTION (from dataset) | GENE SYMBOL | GENE_TITLE | RANK IN GENE LIST | RANK METRIC SCORE | RUNNING ES | CORE ENRICHMENT | |
|---|---|---|---|---|---|---|---|---|
| 1 | GOT2 | 4570164 5220450 | 244 | 1.711 | 0.2562 | Yes | ||
| 2 | PGK1 | 1570494 630300 | 902 | 1.000 | 0.3784 | Yes | ||
| 3 | TPI1 | 1500215 2100154 | 1061 | 0.922 | 0.5150 | Yes | ||
| 4 | GOT1 | 2940465 | 1270 | 0.808 | 0.6311 | Yes | ||
| 5 | SLC25A11 | 130097 770685 | 1492 | 0.717 | 0.7322 | Yes | ||
| 6 | SLC25A1 | 4050402 | 2300 | 0.442 | 0.7584 | Yes | ||
| 7 | PCK1 | 7000358 | 4677 | 0.113 | 0.6485 | No | ||
| 8 | FBP2 | 1580193 | 4749 | 0.109 | 0.6618 | No | ||
| 9 | MDH1 | 6660358 6760731 | 5747 | 0.065 | 0.6185 | No | ||
| 10 | MDH2 | 1850601 | 6402 | 0.047 | 0.5908 | No | ||
| 11 | G6PC | 430093 | 16141 | -0.416 | 0.1330 | No |

