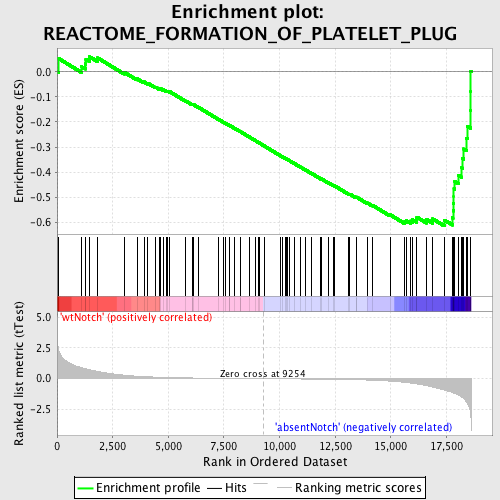
Profile of the Running ES Score & Positions of GeneSet Members on the Rank Ordered List
| Dataset | Set_03_absentNotch_versus_wtNotch.phenotype_absentNotch_versus_wtNotch.cls #wtNotch_versus_absentNotch |
| Phenotype | phenotype_absentNotch_versus_wtNotch.cls#wtNotch_versus_absentNotch |
| Upregulated in class | absentNotch |
| GeneSet | REACTOME_FORMATION_OF_PLATELET_PLUG |
| Enrichment Score (ES) | -0.6146207 |
| Normalized Enrichment Score (NES) | -1.6919731 |
| Nominal p-value | 0.0 |
| FDR q-value | 0.38194367 |
| FWER p-Value | 0.444 |
| PROBE | DESCRIPTION (from dataset) | GENE SYMBOL | GENE_TITLE | RANK IN GENE LIST | RANK METRIC SCORE | RUNNING ES | CORE ENRICHMENT | |
|---|---|---|---|---|---|---|---|---|
| 1 | ALDOA | 6290672 | 72 | 2.228 | 0.0526 | No | ||
| 2 | PLCG2 | 5720008 | 1101 | 0.899 | 0.0199 | No | ||
| 3 | SELP | 6040193 | 1269 | 0.808 | 0.0314 | No | ||
| 4 | CSK | 6350593 | 1294 | 0.796 | 0.0503 | No | ||
| 5 | VAV1 | 6020487 | 1466 | 0.727 | 0.0594 | No | ||
| 6 | PIK3CG | 5890110 | 1823 | 0.589 | 0.0552 | No | ||
| 7 | TBXA2R | 2370292 3940066 | 3016 | 0.286 | -0.0019 | No | ||
| 8 | SOS1 | 7050338 | 3591 | 0.201 | -0.0278 | No | ||
| 9 | SERPINF2 | 2470390 2690292 | 3905 | 0.169 | -0.0404 | No | ||
| 10 | F2R | 4810180 | 4071 | 0.155 | -0.0453 | No | ||
| 11 | F2 | 5720280 | 4430 | 0.127 | -0.0614 | No | ||
| 12 | GP5 | 2510088 | 4616 | 0.116 | -0.0685 | No | ||
| 13 | THBS1 | 4560494 430288 | 4657 | 0.114 | -0.0677 | No | ||
| 14 | FGG | 4610717 | 4777 | 0.107 | -0.0714 | No | ||
| 15 | FN1 | 1170601 2970647 6220288 6940037 | 4923 | 0.099 | -0.0768 | No | ||
| 16 | EGF | 5220154 | 4980 | 0.096 | -0.0773 | No | ||
| 17 | VWF | 4670519 | 5064 | 0.092 | -0.0795 | No | ||
| 18 | PTPN1 | 2650056 | 5784 | 0.064 | -0.1166 | No | ||
| 19 | LYN | 6040600 | 6066 | 0.056 | -0.1304 | No | ||
| 20 | ITGB3 | 5270463 | 6086 | 0.056 | -0.1300 | No | ||
| 21 | HGF | 3360593 | 6118 | 0.055 | -0.1303 | No | ||
| 22 | A2M | 6620039 | 6360 | 0.049 | -0.1421 | No | ||
| 23 | SPARC | 1690086 | 7266 | 0.030 | -0.1901 | No | ||
| 24 | FGB | 7000010 | 7488 | 0.026 | -0.2014 | No | ||
| 25 | SERPINE1 | 4210403 | 7590 | 0.025 | -0.2062 | No | ||
| 26 | LCP2 | 2680066 6650707 | 7738 | 0.022 | -0.2136 | No | ||
| 27 | PLA2G4A | 6380364 | 7770 | 0.021 | -0.2147 | No | ||
| 28 | GP1BA | 6590372 | 7957 | 0.019 | -0.2243 | No | ||
| 29 | HRG | 2340161 | 8227 | 0.015 | -0.2384 | No | ||
| 30 | CD36 | 5890575 | 8238 | 0.014 | -0.2386 | No | ||
| 31 | PIK3R1 | 4730671 | 8630 | 0.008 | -0.2595 | No | ||
| 32 | ITGA2B | 2680538 | 8927 | 0.004 | -0.2753 | No | ||
| 33 | ADRA2A | 5340520 | 9041 | 0.003 | -0.2813 | No | ||
| 34 | AKT1 | 5290746 | 9115 | 0.002 | -0.2852 | No | ||
| 35 | APBB1IP | 4560441 4570706 6520739 | 9325 | -0.001 | -0.2965 | No | ||
| 36 | FCER1G | 5550020 | 10022 | -0.011 | -0.3338 | No | ||
| 37 | KNG1 | 6400576 6770347 | 10116 | -0.012 | -0.3385 | No | ||
| 38 | F2RL2 | 6110736 | 10266 | -0.014 | -0.3462 | No | ||
| 39 | F8 | 2190647 2340465 | 10330 | -0.015 | -0.3492 | No | ||
| 40 | LEFTY2 | 5670364 | 10346 | -0.015 | -0.3496 | No | ||
| 41 | GP9 | 1190181 | 10431 | -0.017 | -0.3537 | No | ||
| 42 | PLG | 3360270 3840100 | 10651 | -0.020 | -0.3650 | No | ||
| 43 | P2RY1 | 6040121 | 10954 | -0.025 | -0.3807 | No | ||
| 44 | CFD | 2320736 | 11161 | -0.028 | -0.3911 | No | ||
| 45 | PPBP | 5130446 | 11414 | -0.032 | -0.4038 | No | ||
| 46 | BCAR1 | 1340215 | 11859 | -0.041 | -0.4268 | No | ||
| 47 | GP1BB | 3780075 | 11895 | -0.041 | -0.4276 | No | ||
| 48 | TMSB4X | 6620114 | 12177 | -0.048 | -0.4416 | No | ||
| 49 | SYK | 6940133 | 12413 | -0.053 | -0.4529 | No | ||
| 50 | RAP1A | 1090025 | 12489 | -0.055 | -0.4555 | No | ||
| 51 | F5 | 1990619 | 13117 | -0.074 | -0.4875 | No | ||
| 52 | STXBP3 | 780706 | 13148 | -0.075 | -0.4872 | No | ||
| 53 | MMRN1 | 7050278 | 13437 | -0.086 | -0.5006 | No | ||
| 54 | PROS1 | 5420465 | 13452 | -0.086 | -0.4991 | No | ||
| 55 | GNAQ | 430670 4210131 5900736 | 13945 | -0.110 | -0.5229 | No | ||
| 56 | COL1A1 | 730020 | 14172 | -0.124 | -0.5319 | No | ||
| 57 | FGA | 4210056 5220239 | 14963 | -0.193 | -0.5697 | No | ||
| 58 | P2RX1 | 2940021 3290338 | 15631 | -0.296 | -0.5981 | Yes | ||
| 59 | FYN | 2100468 4760520 4850687 | 15696 | -0.311 | -0.5937 | Yes | ||
| 60 | TIMP1 | 1010326 | 15882 | -0.351 | -0.5948 | Yes | ||
| 61 | COL1A2 | 380364 | 15969 | -0.373 | -0.5900 | Yes | ||
| 62 | MAPK14 | 5290731 | 16148 | -0.418 | -0.5890 | Yes | ||
| 63 | SERPING1 | 5550440 | 16170 | -0.424 | -0.5794 | Yes | ||
| 64 | STX4 | 6270632 | 16609 | -0.564 | -0.5887 | Yes | ||
| 65 | IGF1 | 1990193 3130377 3290280 | 16886 | -0.674 | -0.5865 | Yes | ||
| 66 | LAMP2 | 1230402 1980373 | 17408 | -0.932 | -0.5910 | Yes | ||
| 67 | PIK3CB | 3800600 | 17779 | -1.134 | -0.5822 | Yes | ||
| 68 | CLU | 5420075 | 17796 | -1.148 | -0.5540 | Yes | ||
| 69 | PDPK1 | 6650168 | 17818 | -1.163 | -0.5256 | Yes | ||
| 70 | FYB | 1690440 | 17835 | -1.178 | -0.4966 | Yes | ||
| 71 | APP | 2510053 | 17838 | -1.180 | -0.4668 | Yes | ||
| 72 | GNA13 | 4590102 | 17876 | -1.205 | -0.4383 | Yes | ||
| 73 | ACTN4 | 3840301 4590390 7050132 | 18044 | -1.337 | -0.4134 | Yes | ||
| 74 | GNB1 | 2120397 | 18190 | -1.508 | -0.3830 | Yes | ||
| 75 | PF4 | 6130332 | 18220 | -1.542 | -0.3455 | Yes | ||
| 76 | GNG2 | 2230390 | 18284 | -1.627 | -0.3077 | Yes | ||
| 77 | CD9 | 4730041 | 18408 | -1.912 | -0.2659 | Yes | ||
| 78 | CD63 | 6660451 | 18443 | -1.986 | -0.2174 | Yes | ||
| 79 | ITGB1 | 5080156 6270528 | 18580 | -2.818 | -0.1533 | Yes | ||
| 80 | PTK2 | 1780148 | 18588 | -3.004 | -0.0775 | Yes | ||
| 81 | PRKCZ | 3780279 | 18595 | -3.117 | 0.0011 | Yes |

