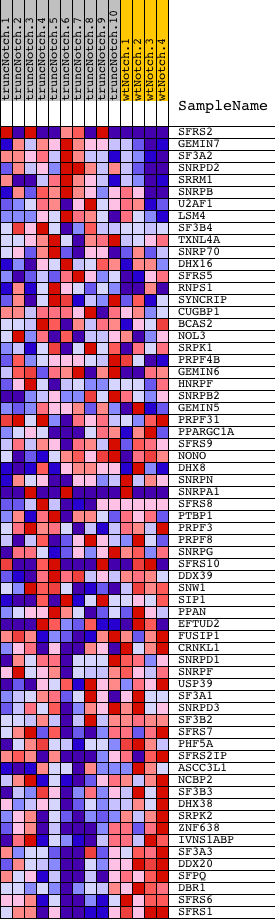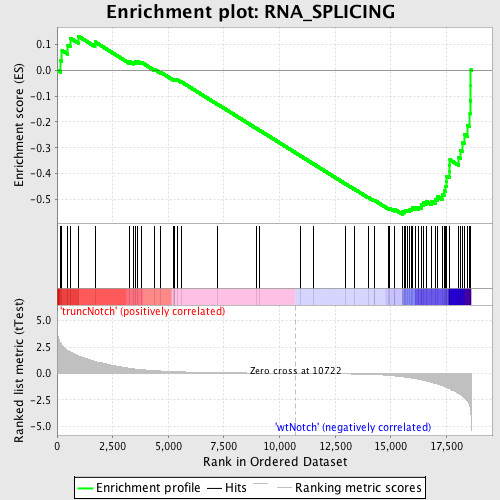
Profile of the Running ES Score & Positions of GeneSet Members on the Rank Ordered List
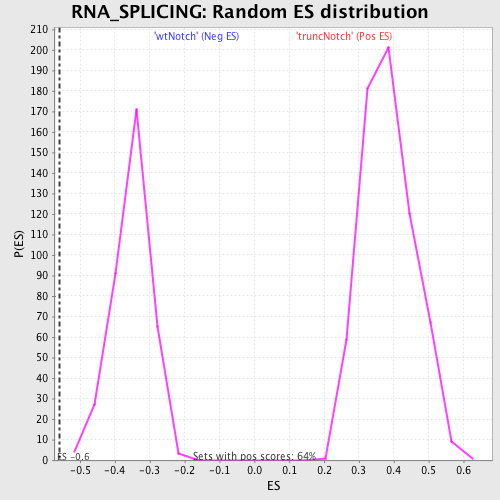
| Dataset | Set_03_truncNotch_versus_wtNotch.phenotype_truncNotch_versus_wtNotch.cls #truncNotch_versus_wtNotch |
| Phenotype | phenotype_truncNotch_versus_wtNotch.cls#truncNotch_versus_wtNotch |
| Upregulated in class | wtNotch |
| GeneSet | RNA_SPLICING |
| Enrichment Score (ES) | -0.5580488 |
| Normalized Enrichment Score (NES) | -1.5876461 |
| Nominal p-value | 0.0 |
| FDR q-value | 0.3219434 |
| FWER p-Value | 0.994 |
| PROBE | DESCRIPTION (from dataset) | GENE SYMBOL | GENE_TITLE | RANK IN GENE LIST | RANK METRIC SCORE | RUNNING ES | CORE ENRICHMENT | |
|---|---|---|---|---|---|---|---|---|
| 1 | SFRS2 | 50707 380593 | 159 | 2.828 | 0.0369 | No | ||
| 2 | GEMIN7 | 2320433 | 218 | 2.656 | 0.0765 | No | ||
| 3 | SF3A2 | 3140500 | 485 | 2.158 | 0.0968 | No | ||
| 4 | SNRPD2 | 6110035 | 586 | 2.033 | 0.1241 | No | ||
| 5 | SRRM1 | 6110025 | 948 | 1.674 | 0.1316 | No | ||
| 6 | SNRPB | 1230097 2940086 3520671 | 1704 | 1.142 | 0.1092 | No | ||
| 7 | U2AF1 | 5130292 | 3252 | 0.480 | 0.0336 | No | ||
| 8 | LSM4 | 3130180 | 3437 | 0.430 | 0.0306 | No | ||
| 9 | SF3B4 | 110072 | 3511 | 0.414 | 0.0333 | No | ||
| 10 | TXNL4A | 4120286 6510242 | 3624 | 0.391 | 0.0335 | No | ||
| 11 | SNRP70 | 4200181 | 3783 | 0.355 | 0.0307 | No | ||
| 12 | DHX16 | 940044 | 4372 | 0.263 | 0.0032 | No | ||
| 13 | SFRS5 | 3450176 6350008 | 4650 | 0.228 | -0.0080 | No | ||
| 14 | RNPS1 | 610736 1090021 | 5235 | 0.170 | -0.0368 | No | ||
| 15 | SYNCRIP | 1690195 3140113 4670279 | 5278 | 0.167 | -0.0363 | No | ||
| 16 | CUGBP1 | 450292 510022 7050176 7050215 | 5294 | 0.166 | -0.0345 | No | ||
| 17 | BCAS2 | 2340494 | 5393 | 0.158 | -0.0372 | No | ||
| 18 | NOL3 | 4060605 4670121 6620487 | 5578 | 0.145 | -0.0448 | No | ||
| 19 | SRPK1 | 450110 | 7205 | 0.070 | -0.1313 | No | ||
| 20 | PRPF4B | 940181 2570300 | 8962 | 0.029 | -0.2255 | No | ||
| 21 | GEMIN6 | 2120288 3830176 | 9095 | 0.027 | -0.2322 | No | ||
| 22 | HNRPF | 670138 | 10939 | -0.004 | -0.3315 | No | ||
| 23 | SNRPB2 | 5720577 | 11503 | -0.013 | -0.3616 | No | ||
| 24 | GEMIN5 | 3120577 | 12968 | -0.047 | -0.4398 | No | ||
| 25 | PRPF31 | 6100360 | 13350 | -0.061 | -0.4594 | No | ||
| 26 | PPARGC1A | 4670040 | 13995 | -0.094 | -0.4926 | No | ||
| 27 | SFRS9 | 3800047 | 14243 | -0.112 | -0.5041 | No | ||
| 28 | NONO | 7050014 | 14261 | -0.114 | -0.5032 | No | ||
| 29 | DHX8 | 6100139 | 14910 | -0.188 | -0.5351 | No | ||
| 30 | SNRPN | 4670195 5890494 6620110 | 14960 | -0.196 | -0.5346 | No | ||
| 31 | SNRPA1 | 1050735 6110131 | 15150 | -0.231 | -0.5410 | No | ||
| 32 | SFRS8 | 5130162 5700164 | 15177 | -0.235 | -0.5386 | No | ||
| 33 | PTBP1 | 4070736 | 15538 | -0.319 | -0.5529 | Yes | ||
| 34 | PRPF3 | 2510435 2940593 3610113 5390722 | 15542 | -0.320 | -0.5479 | Yes | ||
| 35 | PRPF8 | 1230497 1570600 | 15625 | -0.345 | -0.5468 | Yes | ||
| 36 | SNRPG | 2340551 | 15653 | -0.353 | -0.5426 | Yes | ||
| 37 | SFRS10 | 6130528 6400438 7040112 | 15755 | -0.384 | -0.5419 | Yes | ||
| 38 | DDX39 | 3840148 | 15857 | -0.421 | -0.5405 | Yes | ||
| 39 | SNW1 | 4010736 | 15922 | -0.442 | -0.5369 | Yes | ||
| 40 | SIP1 | 2640706 | 15960 | -0.456 | -0.5315 | Yes | ||
| 41 | PPAN | 540398 | 16095 | -0.498 | -0.5308 | Yes | ||
| 42 | EFTUD2 | 2470707 4610148 | 16247 | -0.554 | -0.5300 | Yes | ||
| 43 | FUSIP1 | 520082 5390114 | 16369 | -0.602 | -0.5268 | Yes | ||
| 44 | CRNKL1 | 5050097 | 16380 | -0.607 | -0.5176 | Yes | ||
| 45 | SNRPD1 | 4480162 | 16482 | -0.653 | -0.5126 | Yes | ||
| 46 | SNRPF | 3170280 | 16586 | -0.700 | -0.5069 | Yes | ||
| 47 | USP39 | 1090242 3520435 4760736 | 16845 | -0.862 | -0.5069 | Yes | ||
| 48 | SF3A1 | 1580315 | 17005 | -0.970 | -0.4999 | Yes | ||
| 49 | SNRPD3 | 2970050 | 17096 | -1.004 | -0.4886 | Yes | ||
| 50 | SF3B2 | 6590576 | 17310 | -1.148 | -0.4816 | Yes | ||
| 51 | SFRS7 | 2760408 | 17394 | -1.224 | -0.4664 | Yes | ||
| 52 | PHF5A | 2690519 | 17471 | -1.284 | -0.4499 | Yes | ||
| 53 | SFRS2IP | 730687 1500373 | 17499 | -1.317 | -0.4301 | Yes | ||
| 54 | ASCC3L1 | 6620494 | 17510 | -1.328 | -0.4093 | Yes | ||
| 55 | NCBP2 | 5340500 | 17626 | -1.442 | -0.3923 | Yes | ||
| 56 | SF3B3 | 3710044 | 17631 | -1.449 | -0.3693 | Yes | ||
| 57 | DHX38 | 780243 | 17656 | -1.474 | -0.3468 | Yes | ||
| 58 | SRPK2 | 6380341 | 18036 | -1.872 | -0.3372 | Yes | ||
| 59 | ZNF638 | 6510112 | 18122 | -1.998 | -0.3096 | Yes | ||
| 60 | IVNS1ABP | 4760601 6520113 | 18205 | -2.117 | -0.2800 | Yes | ||
| 61 | SF3A3 | 6660603 | 18303 | -2.281 | -0.2486 | Yes | ||
| 62 | DDX20 | 3290348 | 18454 | -2.649 | -0.2141 | Yes | ||
| 63 | SFPQ | 4760110 | 18556 | -3.132 | -0.1692 | Yes | ||
| 64 | DBR1 | 1770286 | 18564 | -3.218 | -0.1178 | Yes | ||
| 65 | SFRS6 | 60224 | 18598 | -3.719 | -0.0598 | Yes | ||
| 66 | SFRS1 | 2360440 | 18601 | -3.775 | 0.0008 | Yes |