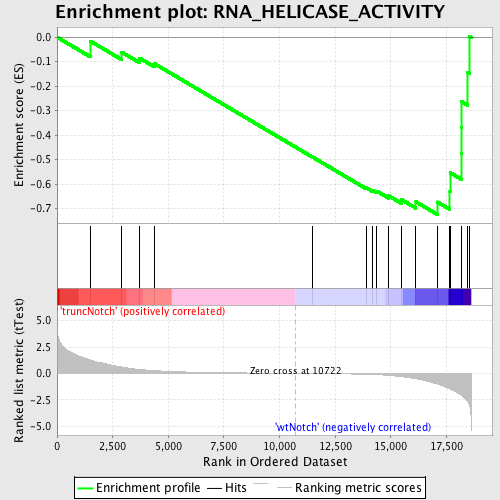
Profile of the Running ES Score & Positions of GeneSet Members on the Rank Ordered List
| Dataset | Set_03_truncNotch_versus_wtNotch.phenotype_truncNotch_versus_wtNotch.cls #truncNotch_versus_wtNotch |
| Phenotype | phenotype_truncNotch_versus_wtNotch.cls#truncNotch_versus_wtNotch |
| Upregulated in class | wtNotch |
| GeneSet | RNA_HELICASE_ACTIVITY |
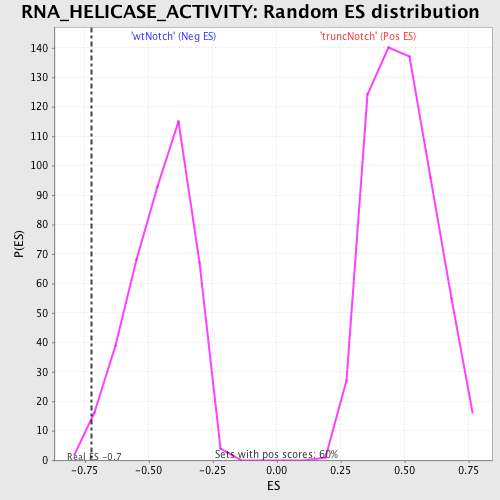
| Enrichment Score (ES) | -0.7237477 |
| Normalized Enrichment Score (NES) | -1.5991855 |
| Nominal p-value | 0.0074257427 |
| FDR q-value | 0.29705632 |
| FWER p-Value | 0.986 |
| PROBE | DESCRIPTION (from dataset) | GENE SYMBOL | GENE_TITLE | RANK IN GENE LIST | RANK METRIC SCORE | RUNNING ES | CORE ENRICHMENT | |
|---|---|---|---|---|---|---|---|---|
| 1 | DDX54 | 6220324 | 1499 | 1.267 | -0.0162 | No | ||
| 2 | EIF4A3 | 3440538 | 2899 | 0.601 | -0.0608 | No | ||
| 3 | G3BP1 | 4780373 7100450 7100576 | 3713 | 0.371 | -0.0857 | No | ||
| 4 | DHX16 | 940044 | 4372 | 0.263 | -0.1077 | No | ||
| 5 | DDX10 | 520746 | 11486 | -0.013 | -0.4895 | No | ||
| 6 | UPF1 | 430164 1190750 | 13888 | -0.087 | -0.6142 | No | ||
| 7 | DHX9 | 60017 1170095 2260014 | 14183 | -0.107 | -0.6246 | No | ||
| 8 | DDX56 | 2030195 | 14365 | -0.123 | -0.6280 | No | ||
| 9 | DHX8 | 6100139 | 14910 | -0.188 | -0.6477 | No | ||
| 10 | SKIV2L | 3780278 4570092 | 15472 | -0.300 | -0.6626 | No | ||
| 11 | DDX6 | 2630025 6770408 | 16128 | -0.510 | -0.6719 | No | ||
| 12 | DDX25 | 5910121 | 17093 | -1.003 | -0.6727 | Yes | ||
| 13 | DHX38 | 780243 | 17656 | -1.474 | -0.6280 | Yes | ||
| 14 | DDX3X | 2190020 | 17667 | -1.484 | -0.5531 | Yes | ||
| 15 | DDX21 | 6100446 | 18174 | -2.073 | -0.4749 | Yes | ||
| 16 | DDX1 | 3450047 | 18181 | -2.082 | -0.3693 | Yes | ||
| 17 | DHX15 | 870632 | 18188 | -2.087 | -0.2635 | Yes | ||
| 18 | DDX20 | 3290348 | 18454 | -2.649 | -0.1430 | Yes | ||
| 19 | DDX18 | 6980619 | 18535 | -2.983 | 0.0044 | Yes |