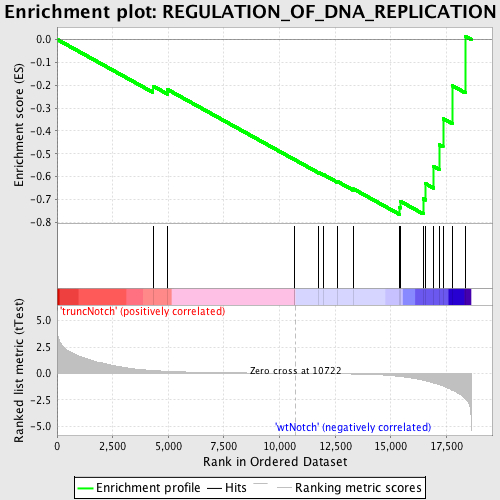
Profile of the Running ES Score & Positions of GeneSet Members on the Rank Ordered List
| Dataset | Set_03_truncNotch_versus_wtNotch.phenotype_truncNotch_versus_wtNotch.cls #truncNotch_versus_wtNotch |
| Phenotype | phenotype_truncNotch_versus_wtNotch.cls#truncNotch_versus_wtNotch |
| Upregulated in class | wtNotch |
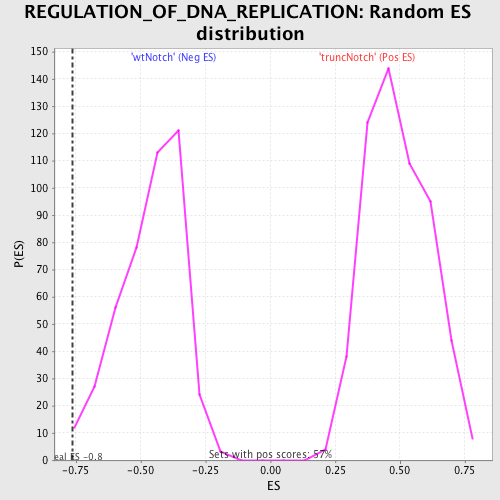
| GeneSet | REGULATION_OF_DNA_REPLICATION |
| Enrichment Score (ES) | -0.7651016 |
| Normalized Enrichment Score (NES) | -1.6550485 |
| Nominal p-value | 0.0069124424 |
| FDR q-value | 0.29232693 |
| FWER p-Value | 0.855 |
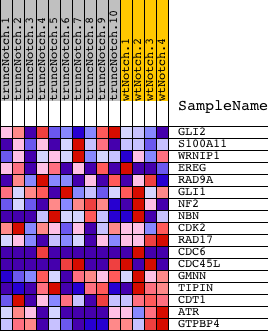
| PROBE | DESCRIPTION (from dataset) | GENE SYMBOL | GENE_TITLE | RANK IN GENE LIST | RANK METRIC SCORE | RUNNING ES | CORE ENRICHMENT | |
|---|---|---|---|---|---|---|---|---|
| 1 | GLI2 | 3060632 | 4310 | 0.270 | -0.2038 | No | ||
| 2 | S100A11 | 2260064 | 4970 | 0.194 | -0.2191 | No | ||
| 3 | WRNIP1 | 2320541 5890725 | 10647 | 0.001 | -0.5241 | No | ||
| 4 | EREG | 50519 4920129 | 10683 | 0.001 | -0.5259 | No | ||
| 5 | RAD9A | 110300 1940632 3990390 6040014 | 11770 | -0.018 | -0.5824 | No | ||
| 6 | GLI1 | 4560176 | 11980 | -0.022 | -0.5914 | No | ||
| 7 | NF2 | 4150735 6450139 | 12588 | -0.036 | -0.6203 | No | ||
| 8 | NBN | 730538 2470619 4780594 | 13322 | -0.060 | -0.6534 | No | ||
| 9 | CDK2 | 130484 2260301 4010088 5050110 | 15400 | -0.284 | -0.7357 | Yes | ||
| 10 | RAD17 | 5220739 | 15422 | -0.288 | -0.7071 | Yes | ||
| 11 | CDC6 | 4570296 5360600 | 16457 | -0.641 | -0.6962 | Yes | ||
| 12 | CDC45L | 70537 3130114 | 16566 | -0.690 | -0.6306 | Yes | ||
| 13 | GMNN | 2630148 | 16925 | -0.916 | -0.5549 | Yes | ||
| 14 | TIPIN | 1570301 2480113 | 17184 | -1.048 | -0.4603 | Yes | ||
| 15 | CDT1 | 3780682 | 17348 | -1.186 | -0.3462 | Yes | ||
| 16 | ATR | 6860273 | 17772 | -1.606 | -0.2026 | Yes | ||
| 17 | GTPBP4 | 6840332 | 18347 | -2.393 | 0.0145 | Yes |