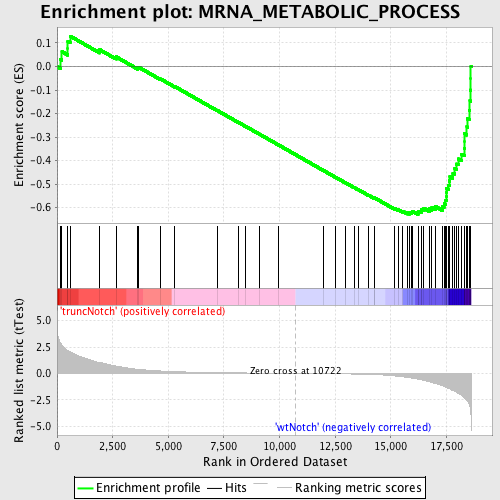
Profile of the Running ES Score & Positions of GeneSet Members on the Rank Ordered List
| Dataset | Set_03_truncNotch_versus_wtNotch.phenotype_truncNotch_versus_wtNotch.cls #truncNotch_versus_wtNotch |
| Phenotype | phenotype_truncNotch_versus_wtNotch.cls#truncNotch_versus_wtNotch |
| Upregulated in class | wtNotch |
| GeneSet | MRNA_METABOLIC_PROCESS |
| Enrichment Score (ES) | -0.6289324 |
| Normalized Enrichment Score (NES) | -1.7189628 |
| Nominal p-value | 0.0 |
| FDR q-value | 0.4223275 |
| FWER p-Value | 0.497 |
| PROBE | DESCRIPTION (from dataset) | GENE SYMBOL | GENE_TITLE | RANK IN GENE LIST | RANK METRIC SCORE | RUNNING ES | CORE ENRICHMENT | |
|---|---|---|---|---|---|---|---|---|
| 1 | SFRS2 | 50707 380593 | 159 | 2.828 | 0.0298 | No | ||
| 2 | GEMIN7 | 2320433 | 218 | 2.656 | 0.0626 | No | ||
| 3 | ZFP36 | 2030605 | 482 | 2.159 | 0.0777 | No | ||
| 4 | SF3A2 | 3140500 | 485 | 2.158 | 0.1068 | No | ||
| 5 | SNRPD2 | 6110035 | 586 | 2.033 | 0.1290 | No | ||
| 6 | LSM3 | 780164 | 1918 | 1.021 | 0.0711 | No | ||
| 7 | NUDT21 | 1240167 | 2650 | 0.696 | 0.0411 | No | ||
| 8 | TXNL4A | 4120286 6510242 | 3624 | 0.391 | -0.0060 | No | ||
| 9 | ELAVL4 | 50735 3360086 5220167 | 3674 | 0.381 | -0.0035 | No | ||
| 10 | SFRS5 | 3450176 6350008 | 4650 | 0.228 | -0.0529 | No | ||
| 11 | CUGBP1 | 450292 510022 7050176 7050215 | 5294 | 0.166 | -0.0854 | No | ||
| 12 | SRPK1 | 450110 | 7205 | 0.070 | -0.1873 | No | ||
| 13 | RNGTT | 780152 780746 1090471 | 8169 | 0.045 | -0.2386 | No | ||
| 14 | SSB | 460286 3140717 | 8480 | 0.039 | -0.2548 | No | ||
| 15 | GEMIN6 | 2120288 3830176 | 9095 | 0.027 | -0.2875 | No | ||
| 16 | LSM5 | 4540398 | 9935 | 0.013 | -0.3326 | No | ||
| 17 | AUH | 5570152 | 11983 | -0.022 | -0.4426 | No | ||
| 18 | CPSF3 | 2480671 | 12515 | -0.034 | -0.4708 | No | ||
| 19 | GEMIN5 | 3120577 | 12968 | -0.047 | -0.4945 | No | ||
| 20 | PRPF31 | 6100360 | 13350 | -0.061 | -0.5142 | No | ||
| 21 | SLBP | 6220601 | 13541 | -0.069 | -0.5235 | No | ||
| 22 | PPARGC1A | 4670040 | 13995 | -0.094 | -0.5466 | No | ||
| 23 | SFRS9 | 3800047 | 14243 | -0.112 | -0.5584 | No | ||
| 24 | NONO | 7050014 | 14261 | -0.114 | -0.5578 | No | ||
| 25 | SFRS8 | 5130162 5700164 | 15177 | -0.235 | -0.6039 | No | ||
| 26 | PABPC1 | 2650180 2690253 6020632 1990270 | 15324 | -0.268 | -0.6082 | No | ||
| 27 | PTBP1 | 4070736 | 15538 | -0.319 | -0.6153 | No | ||
| 28 | SFRS10 | 6130528 6400438 7040112 | 15755 | -0.384 | -0.6217 | Yes | ||
| 29 | DDX39 | 3840148 | 15857 | -0.421 | -0.6215 | Yes | ||
| 30 | SNW1 | 4010736 | 15922 | -0.442 | -0.6189 | Yes | ||
| 31 | SIP1 | 2640706 | 15960 | -0.456 | -0.6148 | Yes | ||
| 32 | SMG6 | 5820243 | 16224 | -0.547 | -0.6215 | Yes | ||
| 33 | EFTUD2 | 2470707 4610148 | 16247 | -0.554 | -0.6152 | Yes | ||
| 34 | FUSIP1 | 520082 5390114 | 16369 | -0.602 | -0.6136 | Yes | ||
| 35 | CRNKL1 | 5050097 | 16380 | -0.607 | -0.6059 | Yes | ||
| 36 | SNRPD1 | 4480162 | 16482 | -0.653 | -0.6025 | Yes | ||
| 37 | CSTF1 | 4610129 | 16731 | -0.795 | -0.6051 | Yes | ||
| 38 | USP39 | 1090242 3520435 4760736 | 16845 | -0.862 | -0.5995 | Yes | ||
| 39 | SF3A1 | 1580315 | 17005 | -0.970 | -0.5949 | Yes | ||
| 40 | KHDRBS1 | 1240403 6040040 | 17319 | -1.152 | -0.5961 | Yes | ||
| 41 | SFRS7 | 2760408 | 17394 | -1.224 | -0.5835 | Yes | ||
| 42 | PHF5A | 2690519 | 17471 | -1.284 | -0.5702 | Yes | ||
| 43 | CPSF1 | 6290064 | 17492 | -1.314 | -0.5535 | Yes | ||
| 44 | SFRS2IP | 730687 1500373 | 17499 | -1.317 | -0.5360 | Yes | ||
| 45 | RNMT | 1770500 | 17507 | -1.327 | -0.5184 | Yes | ||
| 46 | GSPT1 | 5420050 | 17593 | -1.408 | -0.5039 | Yes | ||
| 47 | SF3B3 | 3710044 | 17631 | -1.449 | -0.4862 | Yes | ||
| 48 | DHX38 | 780243 | 17656 | -1.474 | -0.4676 | Yes | ||
| 49 | PAIP1 | 3870576 | 17791 | -1.625 | -0.4528 | Yes | ||
| 50 | SPOP | 450035 | 17876 | -1.710 | -0.4341 | Yes | ||
| 51 | UPF2 | 4810471 | 17962 | -1.793 | -0.4144 | Yes | ||
| 52 | SRPK2 | 6380341 | 18036 | -1.872 | -0.3930 | Yes | ||
| 53 | DHX15 | 870632 | 18188 | -2.087 | -0.3728 | Yes | ||
| 54 | SF3A3 | 6660603 | 18303 | -2.281 | -0.3480 | Yes | ||
| 55 | CDC2L2 | 1400671 5290168 | 18313 | -2.315 | -0.3171 | Yes | ||
| 56 | KIN | 6550014 | 18316 | -2.324 | -0.2858 | Yes | ||
| 57 | GRSF1 | 2100184 | 18421 | -2.543 | -0.2569 | Yes | ||
| 58 | DDX20 | 3290348 | 18454 | -2.649 | -0.2227 | Yes | ||
| 59 | CSTF3 | 3850156 5570458 | 18524 | -2.902 | -0.1871 | Yes | ||
| 60 | SFPQ | 4760110 | 18556 | -3.132 | -0.1463 | Yes | ||
| 61 | CSTF2 | 6040463 | 18583 | -3.529 | -0.0999 | Yes | ||
| 62 | SFRS6 | 60224 | 18598 | -3.719 | -0.0502 | Yes | ||
| 63 | SFRS1 | 2360440 | 18601 | -3.775 | 0.0008 | Yes |

