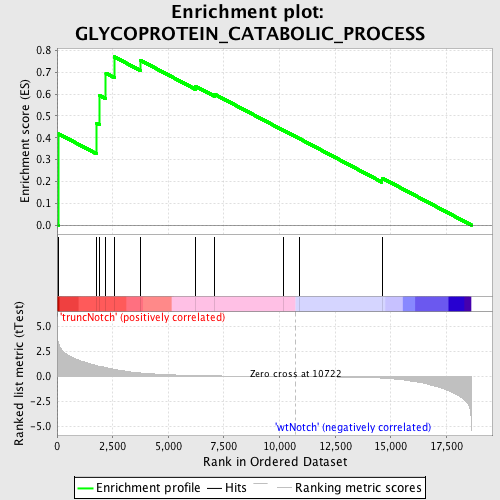
Profile of the Running ES Score & Positions of GeneSet Members on the Rank Ordered List
| Dataset | Set_03_truncNotch_versus_wtNotch.phenotype_truncNotch_versus_wtNotch.cls #truncNotch_versus_wtNotch |
| Phenotype | phenotype_truncNotch_versus_wtNotch.cls#truncNotch_versus_wtNotch |
| Upregulated in class | truncNotch |
| GeneSet | GLYCOPROTEIN_CATABOLIC_PROCESS |
| Enrichment Score (ES) | 0.770512 |
| Normalized Enrichment Score (NES) | 1.4793735 |
| Nominal p-value | 0.035778176 |
| FDR q-value | 0.6553649 |
| FWER p-Value | 1.0 |
| PROBE | DESCRIPTION (from dataset) | GENE SYMBOL | GENE_TITLE | RANK IN GENE LIST | RANK METRIC SCORE | RUNNING ES | CORE ENRICHMENT | |
|---|---|---|---|---|---|---|---|---|
| 1 | PSEN2 | 130382 | 73 | 3.238 | 0.4177 | Yes | ||
| 2 | CLN3 | 780368 | 1784 | 1.082 | 0.4667 | Yes | ||
| 3 | ABCG1 | 60692 | 1916 | 1.022 | 0.5927 | Yes | ||
| 4 | PSEN1 | 130403 2030647 6100603 | 2195 | 0.902 | 0.6952 | Yes | ||
| 5 | NCSTN | 940601 6400594 | 2574 | 0.735 | 0.7705 | Yes | ||
| 6 | MAN2B1 | 4210446 | 3755 | 0.362 | 0.7542 | No | ||
| 7 | APH1A | 4060273 4670465 6450711 | 6224 | 0.108 | 0.6356 | No | ||
| 8 | AGA | 6350292 | 7079 | 0.074 | 0.5993 | No | ||
| 9 | MGEA5 | 6100014 | 10157 | 0.009 | 0.4351 | No | ||
| 10 | ADAMTS9 | 2760079 | 10906 | -0.003 | 0.3953 | No | ||
| 11 | NGLY1 | 1570037 | 14603 | -0.146 | 0.2157 | No |

