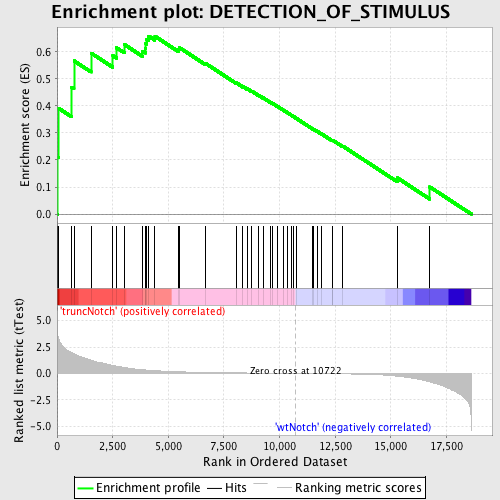
Profile of the Running ES Score & Positions of GeneSet Members on the Rank Ordered List
| Dataset | Set_03_truncNotch_versus_wtNotch.phenotype_truncNotch_versus_wtNotch.cls #truncNotch_versus_wtNotch |
| Phenotype | phenotype_truncNotch_versus_wtNotch.cls#truncNotch_versus_wtNotch |
| Upregulated in class | truncNotch |
| GeneSet | DETECTION_OF_STIMULUS |
| Enrichment Score (ES) | 0.6579868 |
| Normalized Enrichment Score (NES) | 1.5953494 |
| Nominal p-value | 0.005059022 |
| FDR q-value | 0.49101067 |
| FWER p-Value | 0.941 |
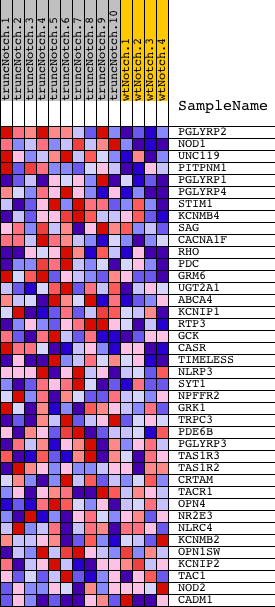
| PROBE | DESCRIPTION (from dataset) | GENE SYMBOL | GENE_TITLE | RANK IN GENE LIST | RANK METRIC SCORE | RUNNING ES | CORE ENRICHMENT | |
|---|---|---|---|---|---|---|---|---|
| 1 | PGLYRP2 | 2340086 | 27 | 3.791 | 0.2100 | Yes | ||
| 2 | NOD1 | 2360368 | 66 | 3.288 | 0.3913 | Yes | ||
| 3 | UNC119 | 360372 | 657 | 1.963 | 0.4690 | Yes | ||
| 4 | PITPNM1 | 4540528 | 760 | 1.847 | 0.5665 | Yes | ||
| 5 | PGLYRP1 | 6760242 | 1527 | 1.254 | 0.5952 | Yes | ||
| 6 | PGLYRP4 | 3780411 | 2506 | 0.763 | 0.5851 | Yes | ||
| 7 | STIM1 | 6380138 | 2665 | 0.692 | 0.6152 | Yes | ||
| 8 | KCNMB4 | 3290347 | 3025 | 0.554 | 0.6268 | Yes | ||
| 9 | SAG | 6550603 | 3842 | 0.346 | 0.6022 | Yes | ||
| 10 | CACNA1F | 2360605 3390450 | 3970 | 0.325 | 0.6135 | Yes | ||
| 11 | RHO | 4280398 | 3986 | 0.323 | 0.6307 | Yes | ||
| 12 | PDC | 3140400 3780184 | 4030 | 0.315 | 0.6460 | Yes | ||
| 13 | GRM6 | 2030398 | 4118 | 0.299 | 0.6580 | Yes | ||
| 14 | UGT2A1 | 5080338 | 4396 | 0.259 | 0.6575 | No | ||
| 15 | ABCA4 | 2370064 3940711 | 5447 | 0.154 | 0.6096 | No | ||
| 16 | KCNIP1 | 6370736 | 5494 | 0.151 | 0.6156 | No | ||
| 17 | RTP3 | 2260176 | 6679 | 0.088 | 0.5567 | No | ||
| 18 | GCK | 2370273 | 8048 | 0.048 | 0.4858 | No | ||
| 19 | CASR | 610504 | 8353 | 0.041 | 0.4717 | No | ||
| 20 | TIMELESS | 3710315 | 8536 | 0.038 | 0.4640 | No | ||
| 21 | NLRP3 | 1980064 4010180 | 8748 | 0.033 | 0.4545 | No | ||
| 22 | SYT1 | 840364 | 9062 | 0.028 | 0.4392 | No | ||
| 23 | NPFFR2 | 2320273 | 9259 | 0.024 | 0.4300 | No | ||
| 24 | GRK1 | 1410112 | 9592 | 0.019 | 0.4132 | No | ||
| 25 | TRPC3 | 840064 | 9699 | 0.017 | 0.4084 | No | ||
| 26 | PDE6B | 2480187 | 9914 | 0.013 | 0.3977 | No | ||
| 27 | PGLYRP3 | 6350403 | 10161 | 0.009 | 0.3849 | No | ||
| 28 | TAS1R3 | 360136 | 10369 | 0.006 | 0.3741 | No | ||
| 29 | TAS1R2 | 4850072 | 10534 | 0.003 | 0.3654 | No | ||
| 30 | CRTAM | 4480110 | 10627 | 0.002 | 0.3606 | No | ||
| 31 | TACR1 | 70358 3840411 | 10741 | -0.000 | 0.3545 | No | ||
| 32 | OPN4 | 5670091 | 11493 | -0.013 | 0.3148 | No | ||
| 33 | NR2E3 | 7050465 | 11527 | -0.013 | 0.3138 | No | ||
| 34 | NLRC4 | 5570332 | 11718 | -0.017 | 0.3045 | No | ||
| 35 | KCNMB2 | 3780128 4760136 | 11869 | -0.020 | 0.2975 | No | ||
| 36 | OPN1SW | 6420377 | 12371 | -0.031 | 0.2723 | No | ||
| 37 | KCNIP2 | 60088 1780324 | 12386 | -0.031 | 0.2733 | No | ||
| 38 | TAC1 | 7000195 380706 | 12847 | -0.043 | 0.2509 | No | ||
| 39 | NOD2 | 2510050 | 15292 | -0.261 | 0.1339 | No | ||
| 40 | CADM1 | 6620128 | 16752 | -0.806 | 0.1003 | No |