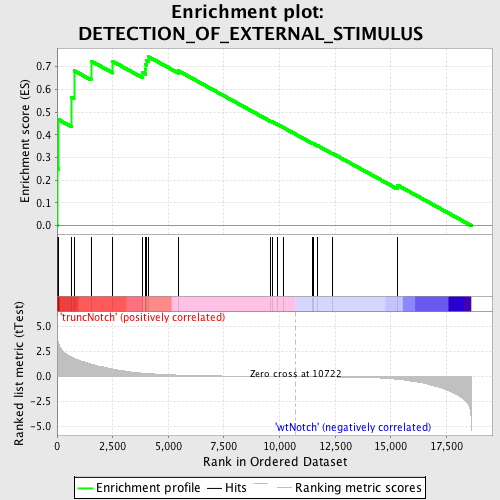
Profile of the Running ES Score & Positions of GeneSet Members on the Rank Ordered List
| Dataset | Set_03_truncNotch_versus_wtNotch.phenotype_truncNotch_versus_wtNotch.cls #truncNotch_versus_wtNotch |
| Phenotype | phenotype_truncNotch_versus_wtNotch.cls#truncNotch_versus_wtNotch |
| Upregulated in class | truncNotch |
| GeneSet | DETECTION_OF_EXTERNAL_STIMULUS |
| Enrichment Score (ES) | 0.7427705 |
| Normalized Enrichment Score (NES) | 1.5731379 |
| Nominal p-value | 0.015410959 |
| FDR q-value | 0.49372756 |
| FWER p-Value | 0.986 |
| PROBE | DESCRIPTION (from dataset) | GENE SYMBOL | GENE_TITLE | RANK IN GENE LIST | RANK METRIC SCORE | RUNNING ES | CORE ENRICHMENT | |
|---|---|---|---|---|---|---|---|---|
| 1 | PGLYRP2 | 2340086 | 27 | 3.791 | 0.2502 | Yes | ||
| 2 | NOD1 | 2360368 | 66 | 3.288 | 0.4665 | Yes | ||
| 3 | UNC119 | 360372 | 657 | 1.963 | 0.5651 | Yes | ||
| 4 | PITPNM1 | 4540528 | 760 | 1.847 | 0.6822 | Yes | ||
| 5 | PGLYRP1 | 6760242 | 1527 | 1.254 | 0.7243 | Yes | ||
| 6 | PGLYRP4 | 3780411 | 2506 | 0.763 | 0.7224 | Yes | ||
| 7 | SAG | 6550603 | 3842 | 0.346 | 0.6736 | Yes | ||
| 8 | CACNA1F | 2360605 3390450 | 3970 | 0.325 | 0.6883 | Yes | ||
| 9 | RHO | 4280398 | 3986 | 0.323 | 0.7090 | Yes | ||
| 10 | PDC | 3140400 3780184 | 4030 | 0.315 | 0.7276 | Yes | ||
| 11 | GRM6 | 2030398 | 4118 | 0.299 | 0.7428 | Yes | ||
| 12 | ABCA4 | 2370064 3940711 | 5447 | 0.154 | 0.6816 | No | ||
| 13 | GRK1 | 1410112 | 9592 | 0.019 | 0.4600 | No | ||
| 14 | TRPC3 | 840064 | 9699 | 0.017 | 0.4554 | No | ||
| 15 | PDE6B | 2480187 | 9914 | 0.013 | 0.4448 | No | ||
| 16 | PGLYRP3 | 6350403 | 10161 | 0.009 | 0.4322 | No | ||
| 17 | OPN4 | 5670091 | 11493 | -0.013 | 0.3614 | No | ||
| 18 | NR2E3 | 7050465 | 11527 | -0.013 | 0.3605 | No | ||
| 19 | NLRC4 | 5570332 | 11718 | -0.017 | 0.3514 | No | ||
| 20 | OPN1SW | 6420377 | 12371 | -0.031 | 0.3184 | No | ||
| 21 | NOD2 | 2510050 | 15292 | -0.261 | 0.1787 | No |

