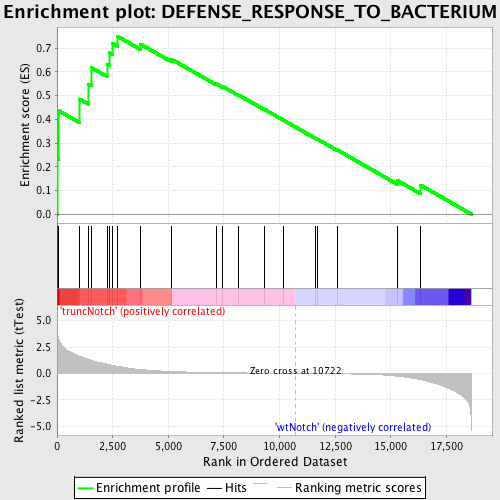
Profile of the Running ES Score & Positions of GeneSet Members on the Rank Ordered List
| Dataset | Set_03_truncNotch_versus_wtNotch.phenotype_truncNotch_versus_wtNotch.cls #truncNotch_versus_wtNotch |
| Phenotype | phenotype_truncNotch_versus_wtNotch.cls#truncNotch_versus_wtNotch |
| Upregulated in class | truncNotch |
| GeneSet | DEFENSE_RESPONSE_TO_BACTERIUM |
| Enrichment Score (ES) | 0.7513646 |
| Normalized Enrichment Score (NES) | 1.5978447 |
| Nominal p-value | 0.0016420361 |
| FDR q-value | 0.5884673 |
| FWER p-Value | 0.932 |
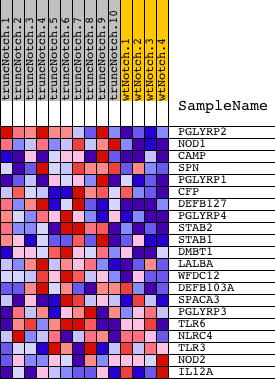
| PROBE | DESCRIPTION (from dataset) | GENE SYMBOL | GENE_TITLE | RANK IN GENE LIST | RANK METRIC SCORE | RUNNING ES | CORE ENRICHMENT | |
|---|---|---|---|---|---|---|---|---|
| 1 | PGLYRP2 | 2340086 | 27 | 3.791 | 0.2343 | Yes | ||
| 2 | NOD1 | 2360368 | 66 | 3.288 | 0.4368 | Yes | ||
| 3 | CAMP | 6290735 | 1017 | 1.602 | 0.4853 | Yes | ||
| 4 | SPN | 3520338 3870671 | 1408 | 1.335 | 0.5474 | Yes | ||
| 5 | PGLYRP1 | 6760242 | 1527 | 1.254 | 0.6190 | Yes | ||
| 6 | CFP | 2100619 | 2274 | 0.868 | 0.6329 | Yes | ||
| 7 | DEFB127 | 520564 | 2351 | 0.830 | 0.6804 | Yes | ||
| 8 | PGLYRP4 | 3780411 | 2506 | 0.763 | 0.7196 | Yes | ||
| 9 | STAB2 | 4810452 | 2698 | 0.676 | 0.7514 | Yes | ||
| 10 | STAB1 | 5390707 | 3742 | 0.364 | 0.7179 | No | ||
| 11 | DMBT1 | 7050270 | 5148 | 0.178 | 0.6534 | No | ||
| 12 | LALBA | 6940685 | 7146 | 0.072 | 0.5505 | No | ||
| 13 | WFDC12 | 6980647 | 7432 | 0.063 | 0.5391 | No | ||
| 14 | DEFB103A | 50014 | 8173 | 0.045 | 0.5022 | No | ||
| 15 | SPACA3 | 1850161 | 9329 | 0.023 | 0.4415 | No | ||
| 16 | PGLYRP3 | 6350403 | 10161 | 0.009 | 0.3974 | No | ||
| 17 | TLR6 | 510102 3390148 | 11610 | -0.015 | 0.3204 | No | ||
| 18 | NLRC4 | 5570332 | 11718 | -0.017 | 0.3157 | No | ||
| 19 | TLR3 | 6760451 | 12583 | -0.036 | 0.2715 | No | ||
| 20 | NOD2 | 2510050 | 15292 | -0.261 | 0.1421 | No | ||
| 21 | IL12A | 7100551 | 16333 | -0.588 | 0.1228 | No |