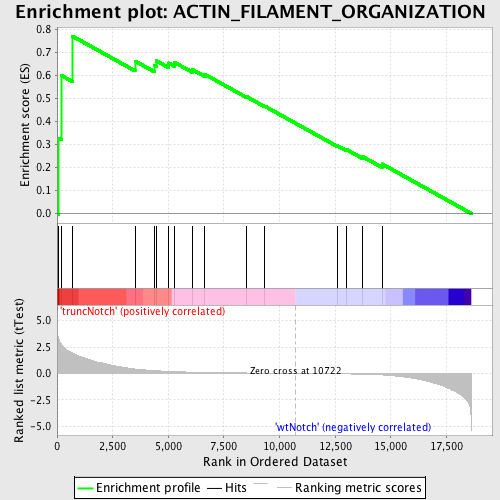
Profile of the Running ES Score & Positions of GeneSet Members on the Rank Ordered List
| Dataset | Set_03_truncNotch_versus_wtNotch.phenotype_truncNotch_versus_wtNotch.cls #truncNotch_versus_wtNotch |
| Phenotype | phenotype_truncNotch_versus_wtNotch.cls#truncNotch_versus_wtNotch |
| Upregulated in class | truncNotch |
| GeneSet | ACTIN_FILAMENT_ORGANIZATION |
| Enrichment Score (ES) | 0.7716133 |
| Normalized Enrichment Score (NES) | 1.5489571 |
| Nominal p-value | 0.013769363 |
| FDR q-value | 0.6237039 |
| FWER p-Value | 1.0 |
| PROBE | DESCRIPTION (from dataset) | GENE SYMBOL | GENE_TITLE | RANK IN GENE LIST | RANK METRIC SCORE | RUNNING ES | CORE ENRICHMENT | |
|---|---|---|---|---|---|---|---|---|
| 1 | KPTN | 3520487 | 77 | 3.228 | 0.3277 | Yes | ||
| 2 | EVL | 1740113 | 201 | 2.713 | 0.6001 | Yes | ||
| 3 | FSCN1 | 3450463 | 688 | 1.922 | 0.7716 | Yes | ||
| 4 | CENTD2 | 60408 2510156 6100494 | 3504 | 0.415 | 0.6630 | No | ||
| 5 | RND1 | 5080300 | 4369 | 0.264 | 0.6436 | No | ||
| 6 | BCAR1 | 1340215 | 4469 | 0.249 | 0.6639 | No | ||
| 7 | DLG1 | 2630091 6020286 | 5006 | 0.191 | 0.6547 | No | ||
| 8 | RHOF | 4070368 | 5292 | 0.166 | 0.6565 | No | ||
| 9 | FSCN2 | 1230039 | 6073 | 0.115 | 0.6264 | No | ||
| 10 | DBN1 | 7100537 | 6614 | 0.091 | 0.6067 | No | ||
| 11 | ARHGEF2 | 3360577 | 8524 | 0.038 | 0.5079 | No | ||
| 12 | ACTA1 | 840538 | 9331 | 0.023 | 0.4670 | No | ||
| 13 | NF2 | 4150735 6450139 | 12588 | -0.036 | 0.2956 | No | ||
| 14 | TSC1 | 1850672 | 13024 | -0.049 | 0.2773 | No | ||
| 15 | PLA2G1B | 460500 | 13742 | -0.079 | 0.2469 | No | ||
| 16 | SORBS3 | 50465 | 14607 | -0.147 | 0.2155 | No |

