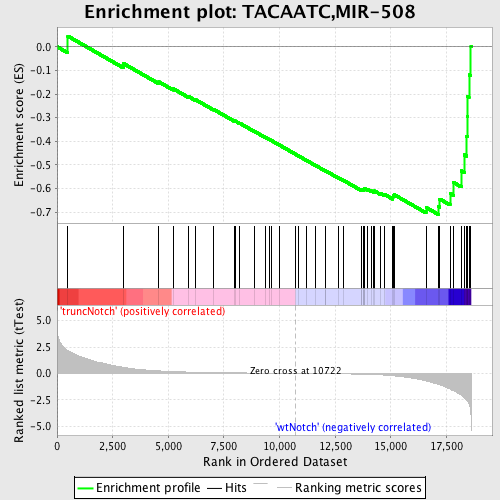
Profile of the Running ES Score & Positions of GeneSet Members on the Rank Ordered List
| Dataset | Set_03_truncNotch_versus_wtNotch.phenotype_truncNotch_versus_wtNotch.cls #truncNotch_versus_wtNotch |
| Phenotype | phenotype_truncNotch_versus_wtNotch.cls#truncNotch_versus_wtNotch |
| Upregulated in class | wtNotch |
| GeneSet | TACAATC,MIR-508 |
| Enrichment Score (ES) | -0.7098427 |
| Normalized Enrichment Score (NES) | -1.8883911 |
| Nominal p-value | 0.0 |
| FDR q-value | 6.482575E-4 |
| FWER p-Value | 0.0020 |
| PROBE | DESCRIPTION (from dataset) | GENE SYMBOL | GENE_TITLE | RANK IN GENE LIST | RANK METRIC SCORE | RUNNING ES | CORE ENRICHMENT | |
|---|---|---|---|---|---|---|---|---|
| 1 | DHDDS | 940148 6650184 | 483 | 2.158 | 0.0451 | No | ||
| 2 | RAPH1 | 6760411 | 2989 | 0.568 | -0.0711 | No | ||
| 3 | GLCE | 4850040 | 4574 | 0.236 | -0.1487 | No | ||
| 4 | HTR2C | 380497 | 5216 | 0.172 | -0.1775 | No | ||
| 5 | CPNE2 | 60551 | 5924 | 0.123 | -0.2115 | No | ||
| 6 | TNPO1 | 730092 2260735 | 6229 | 0.107 | -0.2244 | No | ||
| 7 | VNN3 | 730053 4610609 | 7035 | 0.075 | -0.2653 | No | ||
| 8 | HBP1 | 2510102 3130010 4210619 | 7974 | 0.050 | -0.3141 | No | ||
| 9 | ARL4C | 1190279 | 8003 | 0.049 | -0.3140 | No | ||
| 10 | HOXA1 | 1190524 5420142 | 8202 | 0.045 | -0.3232 | No | ||
| 11 | EIF3S1 | 6130368 6770044 | 8880 | 0.031 | -0.3586 | No | ||
| 12 | GRM8 | 4780082 | 9370 | 0.022 | -0.3842 | No | ||
| 13 | LHX8 | 5700347 | 9537 | 0.020 | -0.3925 | No | ||
| 14 | ARHGEF12 | 3990195 | 9615 | 0.018 | -0.3961 | No | ||
| 15 | ZBTB33 | 2450014 | 9994 | 0.012 | -0.4160 | No | ||
| 16 | NDST1 | 1500427 5340121 | 10735 | -0.000 | -0.4559 | No | ||
| 17 | GDF8 | 3850504 | 10830 | -0.002 | -0.4609 | No | ||
| 18 | RHOQ | 520161 | 11213 | -0.008 | -0.4812 | No | ||
| 19 | FGF7 | 5390484 | 11593 | -0.015 | -0.5011 | No | ||
| 20 | MITF | 380056 | 12042 | -0.024 | -0.5245 | No | ||
| 21 | PHYHIPL | 2360706 3840692 | 12077 | -0.024 | -0.5255 | No | ||
| 22 | BDNF | 2940128 3520368 | 12660 | -0.038 | -0.5556 | No | ||
| 23 | MAP2K1IP1 | 6110091 | 12889 | -0.044 | -0.5664 | No | ||
| 24 | NUMB | 2450735 3800253 6350040 | 13660 | -0.075 | -0.6054 | No | ||
| 25 | HMGA2 | 2940121 3390647 5130279 6400136 | 13670 | -0.076 | -0.6034 | No | ||
| 26 | GRIA2 | 5080088 | 13784 | -0.081 | -0.6068 | No | ||
| 27 | PIP5K3 | 5360112 | 13791 | -0.082 | -0.6044 | No | ||
| 28 | RAD23B | 2190671 | 13794 | -0.082 | -0.6018 | No | ||
| 29 | UBP1 | 6020707 | 13826 | -0.083 | -0.6008 | No | ||
| 30 | RSBN1 | 7000487 | 13951 | -0.091 | -0.6045 | No | ||
| 31 | SORCS1 | 60411 5890373 | 14120 | -0.102 | -0.6101 | No | ||
| 32 | KLF4 | 1850022 3830239 5570750 | 14231 | -0.111 | -0.6124 | No | ||
| 33 | NONO | 7050014 | 14261 | -0.114 | -0.6102 | No | ||
| 34 | NR4A3 | 2900021 5860095 5910039 | 14540 | -0.138 | -0.6206 | No | ||
| 35 | SEPT7 | 2760685 | 14705 | -0.158 | -0.6243 | No | ||
| 36 | CLASP1 | 6860279 | 15087 | -0.218 | -0.6376 | No | ||
| 37 | PTPN9 | 3290408 | 15099 | -0.220 | -0.6310 | No | ||
| 38 | NLK | 2030010 2450041 | 15161 | -0.233 | -0.6266 | No | ||
| 39 | PURB | 5360138 | 16587 | -0.701 | -0.6802 | Yes | ||
| 40 | HMGN1 | 2650026 | 17138 | -1.024 | -0.6761 | Yes | ||
| 41 | EIF2C2 | 770451 | 17196 | -1.057 | -0.6444 | Yes | ||
| 42 | DNAJB1 | 1090041 | 17665 | -1.482 | -0.6208 | Yes | ||
| 43 | PHTF2 | 6590053 | 17821 | -1.656 | -0.5746 | Yes | ||
| 44 | VAPA | 2480594 | 18169 | -2.065 | -0.5252 | Yes | ||
| 45 | RNF103 | 840452 | 18302 | -2.281 | -0.4572 | Yes | ||
| 46 | RANBP9 | 4670685 | 18409 | -2.521 | -0.3799 | Yes | ||
| 47 | ARPP-19 | 5700025 | 18437 | -2.594 | -0.2959 | Yes | ||
| 48 | FCHSD2 | 5720092 | 18449 | -2.628 | -0.2099 | Yes | ||
| 49 | SATB1 | 5670154 | 18517 | -2.867 | -0.1191 | Yes | ||
| 50 | SFRS1 | 2360440 | 18601 | -3.775 | 0.0008 | Yes |

