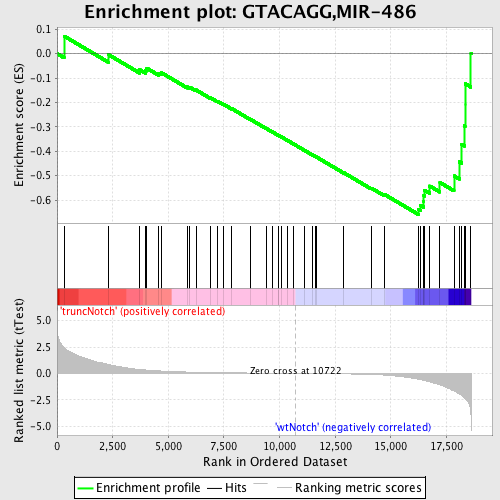
Profile of the Running ES Score & Positions of GeneSet Members on the Rank Ordered List
| Dataset | Set_03_truncNotch_versus_wtNotch.phenotype_truncNotch_versus_wtNotch.cls #truncNotch_versus_wtNotch |
| Phenotype | phenotype_truncNotch_versus_wtNotch.cls#truncNotch_versus_wtNotch |
| Upregulated in class | wtNotch |
| GeneSet | GTACAGG,MIR-486 |
| Enrichment Score (ES) | -0.65911925 |
| Normalized Enrichment Score (NES) | -1.7260455 |
| Nominal p-value | 0.0 |
| FDR q-value | 0.01080317 |
| FWER p-Value | 0.081 |
| PROBE | DESCRIPTION (from dataset) | GENE SYMBOL | GENE_TITLE | RANK IN GENE LIST | RANK METRIC SCORE | RUNNING ES | CORE ENRICHMENT | |
|---|---|---|---|---|---|---|---|---|
| 1 | DOCK3 | 3290273 3360497 2850068 | 315 | 2.424 | 0.0717 | No | ||
| 2 | PIM1 | 630047 | 2298 | 0.856 | -0.0036 | No | ||
| 3 | FGF13 | 630575 1570440 5360121 | 3714 | 0.371 | -0.0663 | No | ||
| 4 | ARMC8 | 520408 940132 4060368 4210102 | 3972 | 0.325 | -0.0682 | No | ||
| 5 | AFF3 | 3870102 | 4032 | 0.315 | -0.0599 | No | ||
| 6 | SRF | 70139 2320039 | 4578 | 0.235 | -0.0806 | No | ||
| 7 | ST5 | 3780204 | 4683 | 0.224 | -0.0780 | No | ||
| 8 | ELAVL2 | 360181 | 5855 | 0.127 | -0.1364 | No | ||
| 9 | MARK1 | 450484 | 5959 | 0.121 | -0.1375 | No | ||
| 10 | DCC | 6450438 | 6243 | 0.107 | -0.1488 | No | ||
| 11 | COPS7B | 2970484 4280022 | 6889 | 0.080 | -0.1806 | No | ||
| 12 | PTPN12 | 2030309 6020725 6130746 6290609 | 7189 | 0.071 | -0.1941 | No | ||
| 13 | NEUROD6 | 4670731 | 7482 | 0.062 | -0.2076 | No | ||
| 14 | UNC5C | 2640056 | 7851 | 0.053 | -0.2255 | No | ||
| 15 | GABRB3 | 4150164 | 8713 | 0.034 | -0.2706 | No | ||
| 16 | PIK3R1 | 4730671 | 9411 | 0.022 | -0.3073 | No | ||
| 17 | PDZRN3 | 2340131 | 9658 | 0.018 | -0.3199 | No | ||
| 18 | DYNLL1 | 5570113 | 9946 | 0.013 | -0.3349 | No | ||
| 19 | ARHGAP5 | 2510619 3360035 | 9961 | 0.013 | -0.3352 | No | ||
| 20 | GAB2 | 1410280 2340520 4280040 | 10087 | 0.010 | -0.3415 | No | ||
| 21 | CNTNAP4 | 3830364 5340347 | 10340 | 0.006 | -0.3549 | No | ||
| 22 | SP5 | 3840309 | 10628 | 0.002 | -0.3703 | No | ||
| 23 | TBX2 | 1990563 | 11105 | -0.006 | -0.3957 | No | ||
| 24 | NCOA6 | 1780333 6450110 | 11461 | -0.012 | -0.4143 | No | ||
| 25 | PUM2 | 4200441 5910446 | 11603 | -0.015 | -0.4214 | No | ||
| 26 | SLC12A5 | 1980692 | 11657 | -0.016 | -0.4236 | No | ||
| 27 | IRX5 | 2630494 | 12888 | -0.044 | -0.4882 | No | ||
| 28 | SORCS1 | 60411 5890373 | 14120 | -0.102 | -0.5508 | No | ||
| 29 | BCORL1 | 1660008 | 14721 | -0.160 | -0.5772 | No | ||
| 30 | FOXO1A | 3120670 | 16243 | -0.553 | -0.6389 | Yes | ||
| 31 | CUGBP2 | 6180121 6840139 | 16339 | -0.592 | -0.6223 | Yes | ||
| 32 | RBBP6 | 2320129 | 16474 | -0.650 | -0.6058 | Yes | ||
| 33 | SNRPD1 | 4480162 | 16482 | -0.653 | -0.5823 | Yes | ||
| 34 | SMOC1 | 840039 | 16510 | -0.670 | -0.5592 | Yes | ||
| 35 | NFAT5 | 2510411 5890195 6550152 | 16745 | -0.804 | -0.5424 | Yes | ||
| 36 | PTEN | 3390064 | 17207 | -1.066 | -0.5282 | Yes | ||
| 37 | TOB1 | 4150138 | 17841 | -1.671 | -0.5011 | Yes | ||
| 38 | MAP3K7 | 6040068 | 18082 | -1.929 | -0.4434 | Yes | ||
| 39 | STK4 | 2640152 | 18189 | -2.091 | -0.3726 | Yes | ||
| 40 | H3F3B | 1410300 | 18304 | -2.281 | -0.2953 | Yes | ||
| 41 | PPP3CB | 6020156 | 18339 | -2.375 | -0.2102 | Yes | ||
| 42 | SFRS3 | 770315 4230593 | 18340 | -2.375 | -0.1233 | Yes | ||
| 43 | SFRS1 | 2360440 | 18601 | -3.775 | 0.0008 | Yes |

