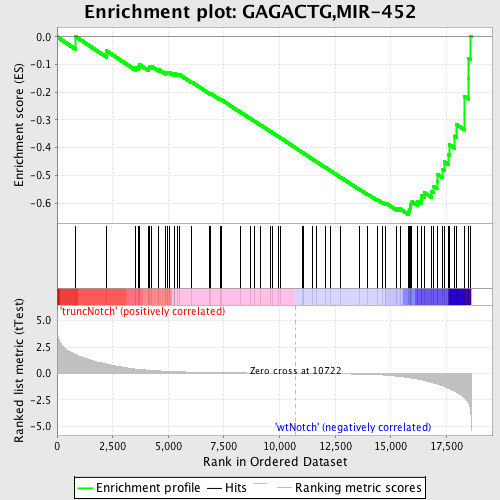
Profile of the Running ES Score & Positions of GeneSet Members on the Rank Ordered List
| Dataset | Set_03_truncNotch_versus_wtNotch.phenotype_truncNotch_versus_wtNotch.cls #truncNotch_versus_wtNotch |
| Phenotype | phenotype_truncNotch_versus_wtNotch.cls#truncNotch_versus_wtNotch |
| Upregulated in class | wtNotch |
| GeneSet | GAGACTG,MIR-452 |
| Enrichment Score (ES) | -0.6411664 |
| Normalized Enrichment Score (NES) | -1.7676883 |
| Nominal p-value | 0.0 |
| FDR q-value | 0.00652324 |
| FWER p-Value | 0.04 |
| PROBE | DESCRIPTION (from dataset) | GENE SYMBOL | GENE_TITLE | RANK IN GENE LIST | RANK METRIC SCORE | RUNNING ES | CORE ENRICHMENT | |
|---|---|---|---|---|---|---|---|---|
| 1 | RBM14 | 5340731 5690315 | 822 | 1.791 | 0.0019 | No | ||
| 2 | TLN1 | 6590411 | 2221 | 0.893 | -0.0504 | No | ||
| 3 | EIF4E | 1580403 70133 6380215 | 3540 | 0.410 | -0.1109 | No | ||
| 4 | AXIN2 | 3850131 | 3666 | 0.383 | -0.1078 | No | ||
| 5 | DCAMKL1 | 540095 2690092 | 3720 | 0.369 | -0.1011 | No | ||
| 6 | LPHN1 | 1400113 3130301 | 4106 | 0.301 | -0.1141 | No | ||
| 7 | PLXNB1 | 6220273 | 4141 | 0.295 | -0.1083 | No | ||
| 8 | SH3GLB1 | 4590079 5670187 | 4231 | 0.279 | -0.1059 | No | ||
| 9 | PPM1G | 610725 | 4570 | 0.236 | -0.1181 | No | ||
| 10 | ITPKA | 6220075 | 4874 | 0.204 | -0.1292 | No | ||
| 11 | CTBP1 | 3780315 | 4950 | 0.196 | -0.1281 | No | ||
| 12 | MTMR4 | 4540524 | 5056 | 0.186 | -0.1290 | No | ||
| 13 | SYNCRIP | 1690195 3140113 4670279 | 5278 | 0.167 | -0.1366 | No | ||
| 14 | CUGBP1 | 450292 510022 7050176 7050215 | 5294 | 0.166 | -0.1331 | No | ||
| 15 | HOXC8 | 6220050 | 5407 | 0.157 | -0.1351 | No | ||
| 16 | GGA3 | 940082 2480167 | 5488 | 0.151 | -0.1355 | No | ||
| 17 | NXPH1 | 3870546 | 6055 | 0.116 | -0.1630 | No | ||
| 18 | EEF2 | 1050369 4670035 5890598 | 6863 | 0.081 | -0.2045 | No | ||
| 19 | CBX1 | 5080408 1980239 | 6915 | 0.079 | -0.2052 | No | ||
| 20 | FLRT3 | 70685 2760497 6040519 | 7322 | 0.067 | -0.2253 | No | ||
| 21 | PPM2C | 3360209 | 7379 | 0.065 | -0.2267 | No | ||
| 22 | MEIS1 | 1400575 | 8223 | 0.044 | -0.2710 | No | ||
| 23 | BCL2L2 | 2760692 6770739 | 8670 | 0.035 | -0.2941 | No | ||
| 24 | ABCC5 | 2100600 5050692 | 8884 | 0.031 | -0.3048 | No | ||
| 25 | ACVR2A | 6110647 | 9148 | 0.026 | -0.3183 | No | ||
| 26 | EPHB3 | 6650341 | 9595 | 0.019 | -0.3419 | No | ||
| 27 | CILP | 4590037 | 9696 | 0.017 | -0.3468 | No | ||
| 28 | DYNLL1 | 5570113 | 9946 | 0.013 | -0.3599 | No | ||
| 29 | ZIC1 | 670113 | 10035 | 0.011 | -0.3644 | No | ||
| 30 | PRICKLE2 | 780408 | 11010 | -0.005 | -0.4167 | No | ||
| 31 | SLC25A27 | 6200707 6940019 | 11096 | -0.006 | -0.4212 | No | ||
| 32 | TAF4 | 1450170 | 11459 | -0.012 | -0.4404 | No | ||
| 33 | LZTS1 | 4150088 | 11651 | -0.016 | -0.4503 | No | ||
| 34 | NPEPPS | 2630731 | 12061 | -0.024 | -0.4717 | No | ||
| 35 | GPR126 | 6650204 | 12286 | -0.029 | -0.4830 | No | ||
| 36 | DPP10 | 4730746 | 12745 | -0.040 | -0.5067 | No | ||
| 37 | PLA2G4A | 6380364 | 13598 | -0.072 | -0.5507 | No | ||
| 38 | RSBN1 | 7000487 | 13951 | -0.091 | -0.5674 | No | ||
| 39 | HIP2 | 2810095 3990369 4120301 | 14405 | -0.126 | -0.5885 | No | ||
| 40 | PRRX1 | 4120193 4480390 | 14623 | -0.149 | -0.5964 | No | ||
| 41 | TNRC15 | 6760746 | 14768 | -0.167 | -0.5998 | No | ||
| 42 | CALU | 2680403 3520056 4610348 5720176 6130121 | 15246 | -0.251 | -0.6191 | No | ||
| 43 | SLC6A9 | 2470520 | 15413 | -0.287 | -0.6206 | No | ||
| 44 | EN1 | 5360168 7050025 | 15795 | -0.400 | -0.6309 | Yes | ||
| 45 | RAB8B | 510692 1980017 3130136 4570739 | 15822 | -0.409 | -0.6217 | Yes | ||
| 46 | DYRK1A | 3190181 | 15866 | -0.423 | -0.6131 | Yes | ||
| 47 | P4HA1 | 2630692 | 15895 | -0.434 | -0.6034 | Yes | ||
| 48 | MOBKL2B | 940128 | 15949 | -0.452 | -0.5946 | Yes | ||
| 49 | PPP1R12A | 4070066 4590162 | 16212 | -0.543 | -0.5947 | Yes | ||
| 50 | ZDHHC5 | 1690711 | 16359 | -0.598 | -0.5872 | Yes | ||
| 51 | TCF12 | 3610324 7000156 | 16383 | -0.608 | -0.5727 | Yes | ||
| 52 | TCF20 | 1190338 1240520 4070594 4810440 | 16515 | -0.671 | -0.5625 | Yes | ||
| 53 | LDB1 | 5270601 | 16834 | -0.855 | -0.5575 | Yes | ||
| 54 | TCF4 | 520021 | 16923 | -0.915 | -0.5387 | Yes | ||
| 55 | CNOT7 | 2450338 5720397 | 17079 | -1.000 | -0.5213 | Yes | ||
| 56 | RORC | 1740121 | 17102 | -1.006 | -0.4965 | Yes | ||
| 57 | SP1 | 6590017 | 17325 | -1.160 | -0.4785 | Yes | ||
| 58 | BCAS3 | 4050647 | 17407 | -1.234 | -0.4511 | Yes | ||
| 59 | CDC42EP3 | 2480138 | 17598 | -1.409 | -0.4249 | Yes | ||
| 60 | PAIP2 | 4210441 | 17643 | -1.457 | -0.3897 | Yes | ||
| 61 | GTF2E1 | 4070014 | 17867 | -1.700 | -0.3579 | Yes | ||
| 62 | RAB35 | 630056 | 17953 | -1.788 | -0.3164 | Yes | ||
| 63 | MAPK6 | 6760520 | 18324 | -2.346 | -0.2758 | Yes | ||
| 64 | ADIPOR2 | 1510035 | 18325 | -2.348 | -0.2152 | Yes | ||
| 65 | RHOT1 | 6760692 | 18504 | -2.826 | -0.1519 | Yes | ||
| 66 | OGT | 2360131 4610333 | 18507 | -2.829 | -0.0791 | Yes | ||
| 67 | PPP2CA | 3990113 | 18569 | -3.290 | 0.0025 | Yes |

