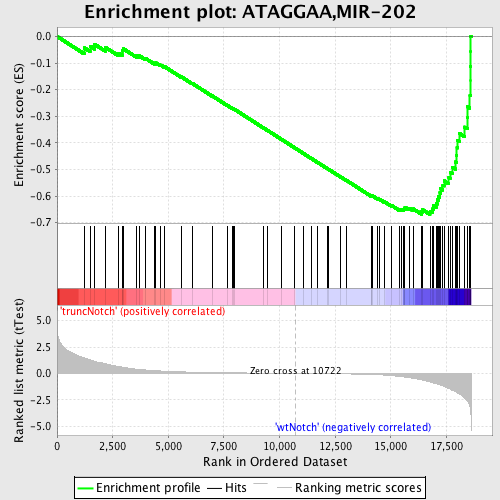
Profile of the Running ES Score & Positions of GeneSet Members on the Rank Ordered List
| Dataset | Set_03_truncNotch_versus_wtNotch.phenotype_truncNotch_versus_wtNotch.cls #truncNotch_versus_wtNotch |
| Phenotype | phenotype_truncNotch_versus_wtNotch.cls#truncNotch_versus_wtNotch |
| Upregulated in class | wtNotch |
| GeneSet | ATAGGAA,MIR-202 |
| Enrichment Score (ES) | -0.6693479 |
| Normalized Enrichment Score (NES) | -1.9188734 |
| Nominal p-value | 0.0 |
| FDR q-value | 0.0 |
| FWER p-Value | 0.0 |
| PROBE | DESCRIPTION (from dataset) | GENE SYMBOL | GENE_TITLE | RANK IN GENE LIST | RANK METRIC SCORE | RUNNING ES | CORE ENRICHMENT | |
|---|---|---|---|---|---|---|---|---|
| 1 | VANGL2 | 70097 870075 | 1224 | 1.458 | -0.0430 | No | ||
| 2 | NDRG1 | 1340040 | 1484 | 1.276 | -0.0368 | No | ||
| 3 | SSBP2 | 2260725 2900400 4730711 | 1689 | 1.151 | -0.0297 | No | ||
| 4 | TARDBP | 870390 2350093 | 2164 | 0.917 | -0.0408 | No | ||
| 5 | EAF1 | 5420039 6550619 | 2760 | 0.645 | -0.0627 | No | ||
| 6 | ZFAND3 | 2760504 | 2926 | 0.591 | -0.0623 | No | ||
| 7 | PPARBP | 4280131 5690022 5860050 | 2928 | 0.591 | -0.0530 | No | ||
| 8 | BCL2 | 730132 1570736 2470138 3800044 4810037 5690068 5860504 6650164 | 2962 | 0.579 | -0.0457 | No | ||
| 9 | ATXN1 | 5550156 | 3574 | 0.402 | -0.0723 | No | ||
| 10 | ARSB | 3190093 5360491 | 3685 | 0.377 | -0.0723 | No | ||
| 11 | DDEF1 | 1170411 4070465 | 3974 | 0.325 | -0.0827 | No | ||
| 12 | GRIA3 | 2900164 6130278 6860154 | 4380 | 0.262 | -0.1004 | No | ||
| 13 | LUZP1 | 940075 4280458 6180070 | 4437 | 0.253 | -0.0994 | No | ||
| 14 | ACVR1 | 6840671 | 4652 | 0.228 | -0.1073 | No | ||
| 15 | HOXB2 | 6450592 | 4812 | 0.210 | -0.1126 | No | ||
| 16 | ROBO2 | 450136 | 5584 | 0.144 | -0.1519 | No | ||
| 17 | KLF12 | 1660095 4810288 5340546 6520286 | 6072 | 0.115 | -0.1764 | No | ||
| 18 | BCL11A | 6860369 | 6966 | 0.077 | -0.2233 | No | ||
| 19 | CPEB3 | 3940164 | 7648 | 0.058 | -0.2591 | No | ||
| 20 | ENAH | 1690292 5700300 | 7869 | 0.052 | -0.2702 | No | ||
| 21 | RKHD3 | 6180471 | 7935 | 0.051 | -0.2729 | No | ||
| 22 | HLF | 2370113 | 7990 | 0.050 | -0.2750 | No | ||
| 23 | RNF121 | 110079 1580279 | 9272 | 0.024 | -0.3437 | No | ||
| 24 | ACSL3 | 3140195 | 9465 | 0.021 | -0.3537 | No | ||
| 25 | ESR1 | 4060372 5860193 | 10104 | 0.010 | -0.3880 | No | ||
| 26 | SPRED1 | 6940706 | 10651 | 0.001 | -0.4174 | No | ||
| 27 | KHDRBS2 | 3520717 | 11079 | -0.006 | -0.4403 | No | ||
| 28 | DNAJC10 | 2350601 | 11430 | -0.012 | -0.4590 | No | ||
| 29 | FAM60A | 3940092 | 11704 | -0.017 | -0.4735 | No | ||
| 30 | KIAA1715 | 1190551 | 12143 | -0.026 | -0.4967 | No | ||
| 31 | SNAP91 | 3170056 5690520 | 12210 | -0.027 | -0.4998 | No | ||
| 32 | RAD52 | 110093 | 12754 | -0.041 | -0.5285 | No | ||
| 33 | NR2F2 | 3170609 3310577 | 12988 | -0.048 | -0.5403 | No | ||
| 34 | SORCS1 | 60411 5890373 | 14120 | -0.102 | -0.5997 | No | ||
| 35 | USP15 | 610592 3520504 | 14148 | -0.104 | -0.5995 | No | ||
| 36 | PCGF2 | 6370347 | 14171 | -0.106 | -0.5990 | No | ||
| 37 | HIP2 | 2810095 3990369 4120301 | 14405 | -0.126 | -0.6096 | No | ||
| 38 | THRAP2 | 4920600 | 14483 | -0.134 | -0.6116 | No | ||
| 39 | TGFBR2 | 1780711 1980537 6550398 | 14702 | -0.157 | -0.6209 | No | ||
| 40 | CBL | 6380068 | 15047 | -0.209 | -0.6361 | No | ||
| 41 | CTBP2 | 430309 3710079 | 15405 | -0.285 | -0.6509 | No | ||
| 42 | BICD2 | 1090411 | 15489 | -0.306 | -0.6505 | No | ||
| 43 | RAB22A | 110500 3830707 | 15584 | -0.331 | -0.6504 | No | ||
| 44 | USP8 | 2640347 3840451 6100672 | 15623 | -0.344 | -0.6470 | No | ||
| 45 | SNX16 | 870446 | 15634 | -0.347 | -0.6421 | No | ||
| 46 | PPP5C | 3130047 | 15821 | -0.409 | -0.6457 | No | ||
| 47 | NARG1 | 5910563 6350095 | 16009 | -0.469 | -0.6483 | No | ||
| 48 | TCF12 | 3610324 7000156 | 16383 | -0.608 | -0.6589 | Yes | ||
| 49 | ERBB2IP | 580253 1090672 | 16411 | -0.621 | -0.6505 | Yes | ||
| 50 | YAF2 | 940053 | 16761 | -0.810 | -0.6566 | Yes | ||
| 51 | TRIM33 | 580619 2230280 3990433 6200747 | 16870 | -0.879 | -0.6485 | Yes | ||
| 52 | RPS6KA3 | 1980707 | 16905 | -0.902 | -0.6361 | Yes | ||
| 53 | CD28 | 1400739 4210093 | 17038 | -0.983 | -0.6277 | Yes | ||
| 54 | BTG1 | 4200735 6040131 6200133 | 17083 | -1.000 | -0.6143 | Yes | ||
| 55 | EI24 | 3120433 | 17145 | -1.027 | -0.6014 | Yes | ||
| 56 | PTEN | 3390064 | 17207 | -1.066 | -0.5879 | Yes | ||
| 57 | CREBBP | 5690035 7040050 | 17238 | -1.091 | -0.5723 | Yes | ||
| 58 | STAT3 | 460040 3710341 | 17338 | -1.177 | -0.5591 | Yes | ||
| 59 | MIB1 | 3800537 | 17399 | -1.228 | -0.5429 | Yes | ||
| 60 | TTC13 | 3520750 | 17606 | -1.416 | -0.5317 | Yes | ||
| 61 | DDX3X | 2190020 | 17667 | -1.484 | -0.5115 | Yes | ||
| 62 | IQGAP1 | 6660494 | 17762 | -1.591 | -0.4915 | Yes | ||
| 63 | CNN3 | 6110020 | 17907 | -1.739 | -0.4718 | Yes | ||
| 64 | SENP1 | 6100537 | 17960 | -1.792 | -0.4463 | Yes | ||
| 65 | RNF11 | 3990068 5080458 | 17973 | -1.812 | -0.4184 | Yes | ||
| 66 | KRAS | 2060170 | 17995 | -1.838 | -0.3905 | Yes | ||
| 67 | RASA1 | 1240315 | 18093 | -1.945 | -0.3651 | Yes | ||
| 68 | MAPK6 | 6760520 | 18324 | -2.346 | -0.3405 | Yes | ||
| 69 | BAG4 | 2260070 | 18441 | -2.614 | -0.3055 | Yes | ||
| 70 | ANP32E | 6510706 | 18450 | -2.630 | -0.2644 | Yes | ||
| 71 | SFPQ | 4760110 | 18556 | -3.132 | -0.2207 | Yes | ||
| 72 | ELF1 | 4780450 | 18577 | -3.453 | -0.1673 | Yes | ||
| 73 | APPBP2 | 5130215 | 18579 | -3.469 | -0.1126 | Yes | ||
| 74 | LBR | 4540671 | 18590 | -3.582 | -0.0566 | Yes | ||
| 75 | MARCKS | 7040450 | 18595 | -3.674 | 0.0011 | Yes |

