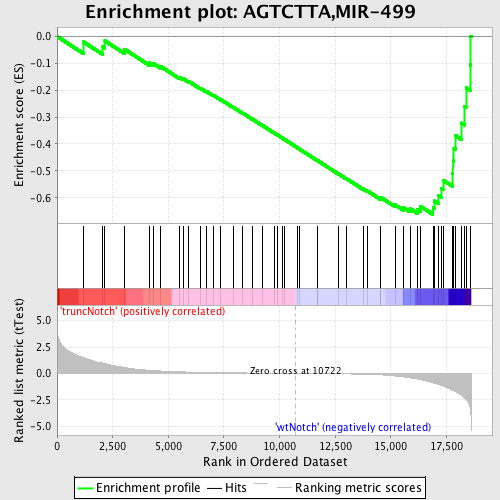
Profile of the Running ES Score & Positions of GeneSet Members on the Rank Ordered List
| Dataset | Set_03_truncNotch_versus_wtNotch.phenotype_truncNotch_versus_wtNotch.cls #truncNotch_versus_wtNotch |
| Phenotype | phenotype_truncNotch_versus_wtNotch.cls#truncNotch_versus_wtNotch |
| Upregulated in class | wtNotch |
| GeneSet | AGTCTTA,MIR-499 |
| Enrichment Score (ES) | -0.6621671 |
| Normalized Enrichment Score (NES) | -1.7536402 |
| Nominal p-value | 0.0 |
| FDR q-value | 0.007196661 |
| FWER p-Value | 0.048 |
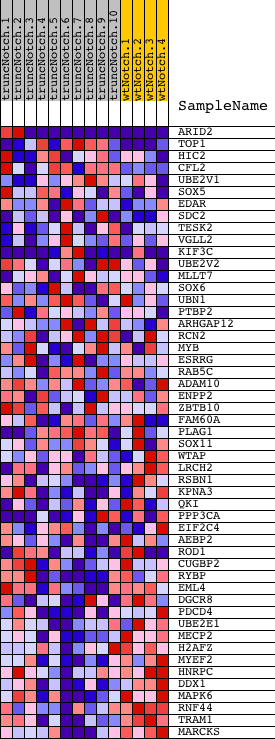
| PROBE | DESCRIPTION (from dataset) | GENE SYMBOL | GENE_TITLE | RANK IN GENE LIST | RANK METRIC SCORE | RUNNING ES | CORE ENRICHMENT | |
|---|---|---|---|---|---|---|---|---|
| 1 | ARID2 | 110647 5390435 | 1184 | 1.479 | -0.0202 | No | ||
| 2 | TOP1 | 770471 4060632 6650324 | 2058 | 0.968 | -0.0387 | No | ||
| 3 | HIC2 | 4010433 | 2150 | 0.923 | -0.0164 | No | ||
| 4 | CFL2 | 380239 6200368 | 3035 | 0.551 | -0.0478 | No | ||
| 5 | UBE2V1 | 2470093 | 4142 | 0.295 | -0.0987 | No | ||
| 6 | SOX5 | 2370576 2900167 3190128 5050528 | 4329 | 0.268 | -0.1008 | No | ||
| 7 | EDAR | 6220670 | 4656 | 0.227 | -0.1116 | No | ||
| 8 | SDC2 | 1980168 | 5487 | 0.151 | -0.1519 | No | ||
| 9 | TESK2 | 6520524 | 5668 | 0.139 | -0.1575 | No | ||
| 10 | VGLL2 | 3940148 7040142 | 5902 | 0.124 | -0.1664 | No | ||
| 11 | KIF3C | 2360162 2940110 | 6430 | 0.098 | -0.1919 | No | ||
| 12 | UBE2V2 | 4210484 | 6707 | 0.087 | -0.2042 | No | ||
| 13 | MLLT7 | 4480707 | 7021 | 0.076 | -0.2188 | No | ||
| 14 | SOX6 | 2940458 4070601 6840717 | 7362 | 0.066 | -0.2352 | No | ||
| 15 | UBN1 | 5900195 | 7928 | 0.051 | -0.2641 | No | ||
| 16 | PTBP2 | 1240398 | 8341 | 0.041 | -0.2851 | No | ||
| 17 | ARHGAP12 | 1050181 | 8760 | 0.033 | -0.3066 | No | ||
| 18 | RCN2 | 840324 | 9218 | 0.025 | -0.3305 | No | ||
| 19 | MYB | 1660494 5860451 6130706 | 9771 | 0.015 | -0.3598 | No | ||
| 20 | ESRRG | 4010181 | 9926 | 0.013 | -0.3677 | No | ||
| 21 | RAB5C | 1990397 | 10140 | 0.009 | -0.3789 | No | ||
| 22 | ADAM10 | 3780156 | 10220 | 0.008 | -0.3829 | No | ||
| 23 | ENPP2 | 5860546 | 10785 | -0.001 | -0.4132 | No | ||
| 24 | ZBTB10 | 4200132 | 10882 | -0.003 | -0.4183 | No | ||
| 25 | FAM60A | 3940092 | 11704 | -0.017 | -0.4620 | No | ||
| 26 | PLAG1 | 1450142 3870139 6520039 | 11711 | -0.017 | -0.4619 | No | ||
| 27 | SOX11 | 610279 | 12668 | -0.038 | -0.5122 | No | ||
| 28 | WTAP | 4010176 | 12992 | -0.048 | -0.5282 | No | ||
| 29 | LRCH2 | 2900162 | 13759 | -0.080 | -0.5671 | No | ||
| 30 | RSBN1 | 7000487 | 13951 | -0.091 | -0.5747 | No | ||
| 31 | KPNA3 | 7040088 | 14523 | -0.137 | -0.6015 | No | ||
| 32 | QKI | 5220093 6130044 | 14544 | -0.139 | -0.5984 | No | ||
| 33 | PPP3CA | 4760332 6760092 | 15201 | -0.243 | -0.6266 | No | ||
| 34 | EIF2C4 | 2940577 5900563 | 15567 | -0.325 | -0.6367 | No | ||
| 35 | AEBP2 | 2970603 | 15863 | -0.423 | -0.6401 | No | ||
| 36 | ROD1 | 2060324 3140332 | 16208 | -0.541 | -0.6427 | Yes | ||
| 37 | CUGBP2 | 6180121 6840139 | 16339 | -0.592 | -0.6323 | Yes | ||
| 38 | RYBP | 60746 | 16895 | -0.894 | -0.6358 | Yes | ||
| 39 | EML4 | 5700373 | 16965 | -0.941 | -0.6118 | Yes | ||
| 40 | DGCR8 | 3450632 | 17135 | -1.022 | -0.5908 | Yes | ||
| 41 | PDCD4 | 3360403 5690110 | 17260 | -1.111 | -0.5647 | Yes | ||
| 42 | UBE2E1 | 4230064 1090440 | 17347 | -1.186 | -0.5344 | Yes | ||
| 43 | MECP2 | 1940450 | 17781 | -1.615 | -0.5101 | Yes | ||
| 44 | H2AFZ | 1470168 | 17794 | -1.628 | -0.4628 | Yes | ||
| 45 | MYEF2 | 6860484 | 17837 | -1.669 | -0.4159 | Yes | ||
| 46 | HNRPC | 1570133 3610131 | 17901 | -1.733 | -0.3682 | Yes | ||
| 47 | DDX1 | 3450047 | 18181 | -2.082 | -0.3219 | Yes | ||
| 48 | MAPK6 | 6760520 | 18324 | -2.346 | -0.2604 | Yes | ||
| 49 | RNF44 | 5910692 | 18381 | -2.469 | -0.1907 | Yes | ||
| 50 | TRAM1 | 2340441 6620592 | 18565 | -3.221 | -0.1056 | Yes | ||
| 51 | MARCKS | 7040450 | 18595 | -3.674 | 0.0011 | Yes |