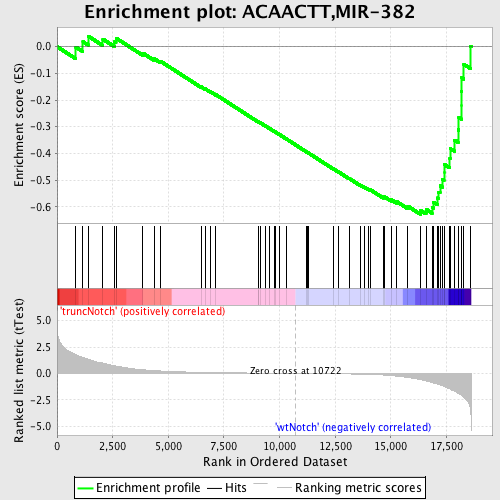
Profile of the Running ES Score & Positions of GeneSet Members on the Rank Ordered List
| Dataset | Set_03_truncNotch_versus_wtNotch.phenotype_truncNotch_versus_wtNotch.cls #truncNotch_versus_wtNotch |
| Phenotype | phenotype_truncNotch_versus_wtNotch.cls#truncNotch_versus_wtNotch |
| Upregulated in class | wtNotch |
| GeneSet | ACAACTT,MIR-382 |
| Enrichment Score (ES) | -0.62901455 |
| Normalized Enrichment Score (NES) | -1.7119212 |
| Nominal p-value | 0.0 |
| FDR q-value | 0.012407758 |
| FWER p-Value | 0.099 |
| PROBE | DESCRIPTION (from dataset) | GENE SYMBOL | GENE_TITLE | RANK IN GENE LIST | RANK METRIC SCORE | RUNNING ES | CORE ENRICHMENT | |
|---|---|---|---|---|---|---|---|---|
| 1 | HPS4 | 6940110 | 844 | 1.760 | -0.0015 | No | ||
| 2 | UBE2H | 1980142 2970079 | 1161 | 1.491 | 0.0188 | No | ||
| 3 | NDRG2 | 450403 | 1396 | 1.340 | 0.0397 | No | ||
| 4 | TOP1 | 770471 4060632 6650324 | 2058 | 0.968 | 0.0282 | No | ||
| 5 | BACH1 | 290195 | 2587 | 0.727 | 0.0180 | No | ||
| 6 | SGK | 1400131 2480056 | 2647 | 0.698 | 0.0322 | No | ||
| 7 | MATR3 | 1940170 5340278 | 3846 | 0.346 | -0.0237 | No | ||
| 8 | AQP6 | 510736 1570484 | 4375 | 0.262 | -0.0456 | No | ||
| 9 | ACVR1 | 6840671 | 4652 | 0.228 | -0.0548 | No | ||
| 10 | HS3ST3B1 | 380040 | 6470 | 0.096 | -0.1502 | No | ||
| 11 | CHST9 | 4560092 | 6653 | 0.089 | -0.1578 | No | ||
| 12 | SLC17A6 | 4210576 | 6885 | 0.080 | -0.1683 | No | ||
| 13 | AMOTL2 | 4730082 | 7137 | 0.072 | -0.1800 | No | ||
| 14 | NFIA | 2760129 5860278 | 9045 | 0.028 | -0.2820 | No | ||
| 15 | SYT1 | 840364 | 9062 | 0.028 | -0.2822 | No | ||
| 16 | EDA | 6420441 | 9136 | 0.026 | -0.2855 | No | ||
| 17 | ZCCHC14 | 5900288 | 9387 | 0.022 | -0.2984 | No | ||
| 18 | LHX8 | 5700347 | 9537 | 0.020 | -0.3059 | No | ||
| 19 | BTBD7 | 730288 | 9752 | 0.016 | -0.3171 | No | ||
| 20 | PDE5A | 130072 | 9812 | 0.015 | -0.3199 | No | ||
| 21 | MTUS1 | 780348 4920609 | 9973 | 0.012 | -0.3282 | No | ||
| 22 | RPE | 940114 | 10320 | 0.006 | -0.3467 | No | ||
| 23 | DACH1 | 2450593 5700592 | 11221 | -0.008 | -0.3950 | No | ||
| 24 | MMP16 | 2680139 | 11237 | -0.009 | -0.3956 | No | ||
| 25 | HSPA14 | 4610487 | 11286 | -0.009 | -0.3979 | No | ||
| 26 | CLTC | 6590458 | 12416 | -0.032 | -0.4579 | No | ||
| 27 | BDNF | 2940128 3520368 | 12660 | -0.038 | -0.4701 | No | ||
| 28 | NEGR1 | 1940731 5130170 | 13122 | -0.053 | -0.4936 | No | ||
| 29 | DDX3Y | 1580278 4200519 | 13648 | -0.075 | -0.5200 | No | ||
| 30 | EN2 | 7000368 | 13806 | -0.082 | -0.5264 | No | ||
| 31 | SORCS3 | 5700309 | 13992 | -0.094 | -0.5341 | No | ||
| 32 | GMFB | 6590035 | 14068 | -0.099 | -0.5356 | No | ||
| 33 | SRGAP2 | 1050092 1230403 3830066 6130215 | 14663 | -0.152 | -0.5638 | No | ||
| 34 | BCORL1 | 1660008 | 14721 | -0.160 | -0.5629 | No | ||
| 35 | SYNC1 | 580114 | 15020 | -0.205 | -0.5738 | No | ||
| 36 | STC1 | 360161 | 15255 | -0.253 | -0.5801 | No | ||
| 37 | ZFP106 | 130292 2370315 3940286 | 15771 | -0.390 | -0.5981 | No | ||
| 38 | ARFGEF1 | 6760494 | 16345 | -0.593 | -0.6142 | Yes | ||
| 39 | MBNL1 | 2640762 7100048 | 16585 | -0.700 | -0.6096 | Yes | ||
| 40 | SEC24C | 6980707 | 16855 | -0.869 | -0.6023 | Yes | ||
| 41 | PPP3CC | 2450139 | 16907 | -0.903 | -0.5825 | Yes | ||
| 42 | PDPK1 | 6650168 | 17086 | -1.001 | -0.5671 | Yes | ||
| 43 | P2RX7 | 6020048 6380053 6510121 | 17153 | -1.034 | -0.5448 | Yes | ||
| 44 | YBX1 | 1340039 4730500 | 17214 | -1.073 | -0.5212 | Yes | ||
| 45 | HSPA2 | 6420592 | 17312 | -1.149 | -0.4978 | Yes | ||
| 46 | SUHW3 | 50400 | 17393 | -1.223 | -0.4715 | Yes | ||
| 47 | ARIH2 | 2810025 | 17396 | -1.227 | -0.4409 | Yes | ||
| 48 | ICK | 1580746 3140021 | 17653 | -1.471 | -0.4180 | Yes | ||
| 49 | DDX3X | 2190020 | 17667 | -1.484 | -0.3816 | Yes | ||
| 50 | BCL11B | 2680673 | 17870 | -1.704 | -0.3499 | Yes | ||
| 51 | SMARCAD1 | 5390619 | 18027 | -1.868 | -0.3116 | Yes | ||
| 52 | EEF1A1 | 1980193 1990195 4670735 | 18057 | -1.897 | -0.2657 | Yes | ||
| 53 | EPC2 | 2470095 | 18175 | -2.073 | -0.2202 | Yes | ||
| 54 | MBNL2 | 3450707 | 18177 | -2.076 | -0.1684 | Yes | ||
| 55 | DHX15 | 870632 | 18188 | -2.087 | -0.1168 | Yes | ||
| 56 | EIF4G3 | 670707 | 18281 | -2.239 | -0.0658 | Yes | ||
| 57 | PRPS2 | 3140707 | 18572 | -3.352 | 0.0024 | Yes |

