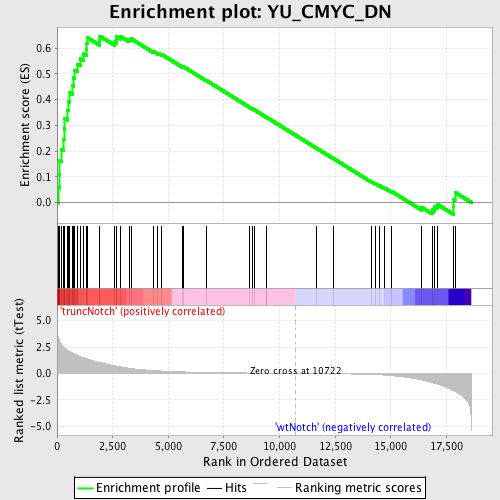
Profile of the Running ES Score & Positions of GeneSet Members on the Rank Ordered List
| Dataset | Set_03_truncNotch_versus_wtNotch.phenotype_truncNotch_versus_wtNotch.cls #truncNotch_versus_wtNotch |
| Phenotype | phenotype_truncNotch_versus_wtNotch.cls#truncNotch_versus_wtNotch |
| Upregulated in class | truncNotch |
| GeneSet | YU_CMYC_DN |
| Enrichment Score (ES) | 0.6474599 |
| Normalized Enrichment Score (NES) | 1.6209357 |
| Nominal p-value | 0.001610306 |
| FDR q-value | 0.14338382 |
| FWER p-Value | 0.924 |
| PROBE | DESCRIPTION (from dataset) | GENE SYMBOL | GENE_TITLE | RANK IN GENE LIST | RANK METRIC SCORE | RUNNING ES | CORE ENRICHMENT | |
|---|---|---|---|---|---|---|---|---|
| 1 | UNC93B1 | 430152 | 41 | 3.487 | 0.0595 | Yes | ||
| 2 | KLF2 | 6860270 | 104 | 3.049 | 0.1101 | Yes | ||
| 3 | H2-DMA | 6290463 | 109 | 3.020 | 0.1633 | Yes | ||
| 4 | EVL | 1740113 | 201 | 2.713 | 0.2063 | Yes | ||
| 5 | BLK | 1940128 5390053 | 289 | 2.471 | 0.2454 | Yes | ||
| 6 | ARHGEF1 | 610347 4850603 6420672 | 319 | 2.412 | 0.2865 | Yes | ||
| 7 | IL10RA | 1770164 | 349 | 2.369 | 0.3268 | Yes | ||
| 8 | GGA2 | 520451 1240082 2650332 | 476 | 2.164 | 0.3583 | Yes | ||
| 9 | CTSH | 60524 | 504 | 2.131 | 0.3946 | Yes | ||
| 10 | H2-DMB1 | 4760026 | 575 | 2.040 | 0.4269 | Yes | ||
| 11 | H2-AA | 5290673 | 696 | 1.916 | 0.4543 | Yes | ||
| 12 | CD2 | 430672 | 723 | 1.885 | 0.4863 | Yes | ||
| 13 | CD37 | 770273 | 786 | 1.825 | 0.5152 | Yes | ||
| 14 | IGH-1A | 360113 4670341 | 919 | 1.696 | 0.5381 | Yes | ||
| 15 | IL4I1 | 3190161 | 1047 | 1.578 | 0.5592 | Yes | ||
| 16 | MAP4K2 | 4200037 | 1181 | 1.482 | 0.5782 | Yes | ||
| 17 | H2-EB1 | 2350079 | 1331 | 1.379 | 0.5946 | Yes | ||
| 18 | DGKA | 5720152 5890328 | 1337 | 1.374 | 0.6186 | Yes | ||
| 19 | SLFN2 | 3120114 | 1348 | 1.370 | 0.6423 | Yes | ||
| 20 | H2-AB1 | 4230427 | 1905 | 1.025 | 0.6305 | Yes | ||
| 21 | LTB | 3990672 | 1925 | 1.016 | 0.6475 | Yes | ||
| 22 | GNS | 3120458 | 2588 | 0.726 | 0.6247 | No | ||
| 23 | ARID3B | 6650008 | 2666 | 0.692 | 0.6327 | No | ||
| 24 | SIPA1 | 5220687 | 2672 | 0.687 | 0.6446 | No | ||
| 25 | LAPTM5 | 5550372 | 2834 | 0.622 | 0.6469 | No | ||
| 26 | ACP5 | 2230717 | 3233 | 0.483 | 0.6340 | No | ||
| 27 | MS4A1 | 4210598 | 3326 | 0.456 | 0.6372 | No | ||
| 28 | H2-OB | 6980059 | 4335 | 0.267 | 0.5876 | No | ||
| 29 | GAD1 | 2360035 3140167 | 4529 | 0.240 | 0.5814 | No | ||
| 30 | MGST1 | 6020605 | 4688 | 0.223 | 0.5769 | No | ||
| 31 | LOC207685 | 6520017 | 5614 | 0.142 | 0.5296 | No | ||
| 32 | CMAH | 1660497 3390398 6550040 | 5685 | 0.138 | 0.5282 | No | ||
| 33 | MACF1 | 1340132 2370176 2900750 6590364 | 6703 | 0.087 | 0.4750 | No | ||
| 34 | ABCA1 | 6290156 | 8659 | 0.035 | 0.3703 | No | ||
| 35 | 5730420B22RIK | 130139 | 8783 | 0.033 | 0.3643 | No | ||
| 36 | SSPN | 4670091 | 8878 | 0.031 | 0.3598 | No | ||
| 37 | 1100001G20RIK | 3610368 | 9408 | 0.022 | 0.3316 | No | ||
| 38 | PYGM | 3940300 | 9415 | 0.022 | 0.3317 | No | ||
| 39 | SRPK3 | 2480278 | 11675 | -0.016 | 0.2103 | No | ||
| 40 | CD1D1 | 5130184 | 12433 | -0.032 | 0.1701 | No | ||
| 41 | GBP4 | 6520471 1980670 | 14113 | -0.102 | 0.0815 | No | ||
| 42 | OLFM1 | 3360161 5570066 | 14298 | -0.117 | 0.0736 | No | ||
| 43 | MYO7A | 2810102 | 14485 | -0.134 | 0.0660 | No | ||
| 44 | IFI203 | 6420102 3610369 | 14731 | -0.160 | 0.0556 | No | ||
| 45 | PRKCB1 | 870019 3130092 | 15039 | -0.207 | 0.0427 | No | ||
| 46 | GDI1 | 4590400 5290358 6020687 6180446 | 16392 | -0.611 | -0.0193 | No | ||
| 47 | RGL2 | 1740017 | 16857 | -0.870 | -0.0289 | No | ||
| 48 | RBMS1 | 6400014 | 16951 | -0.929 | -0.0175 | No | ||
| 49 | BTG1 | 4200735 6040131 6200133 | 17083 | -1.000 | -0.0068 | No | ||
| 50 | PTPRC | 130402 5290148 | 17828 | -1.663 | -0.0175 | No | ||
| 51 | KLF3 | 5130438 | 17834 | -1.666 | 0.0117 | No | ||
| 52 | RAG1 | 2850279 | 17886 | -1.715 | 0.0393 | No |

